
Fig. 3
|
Fig. 3
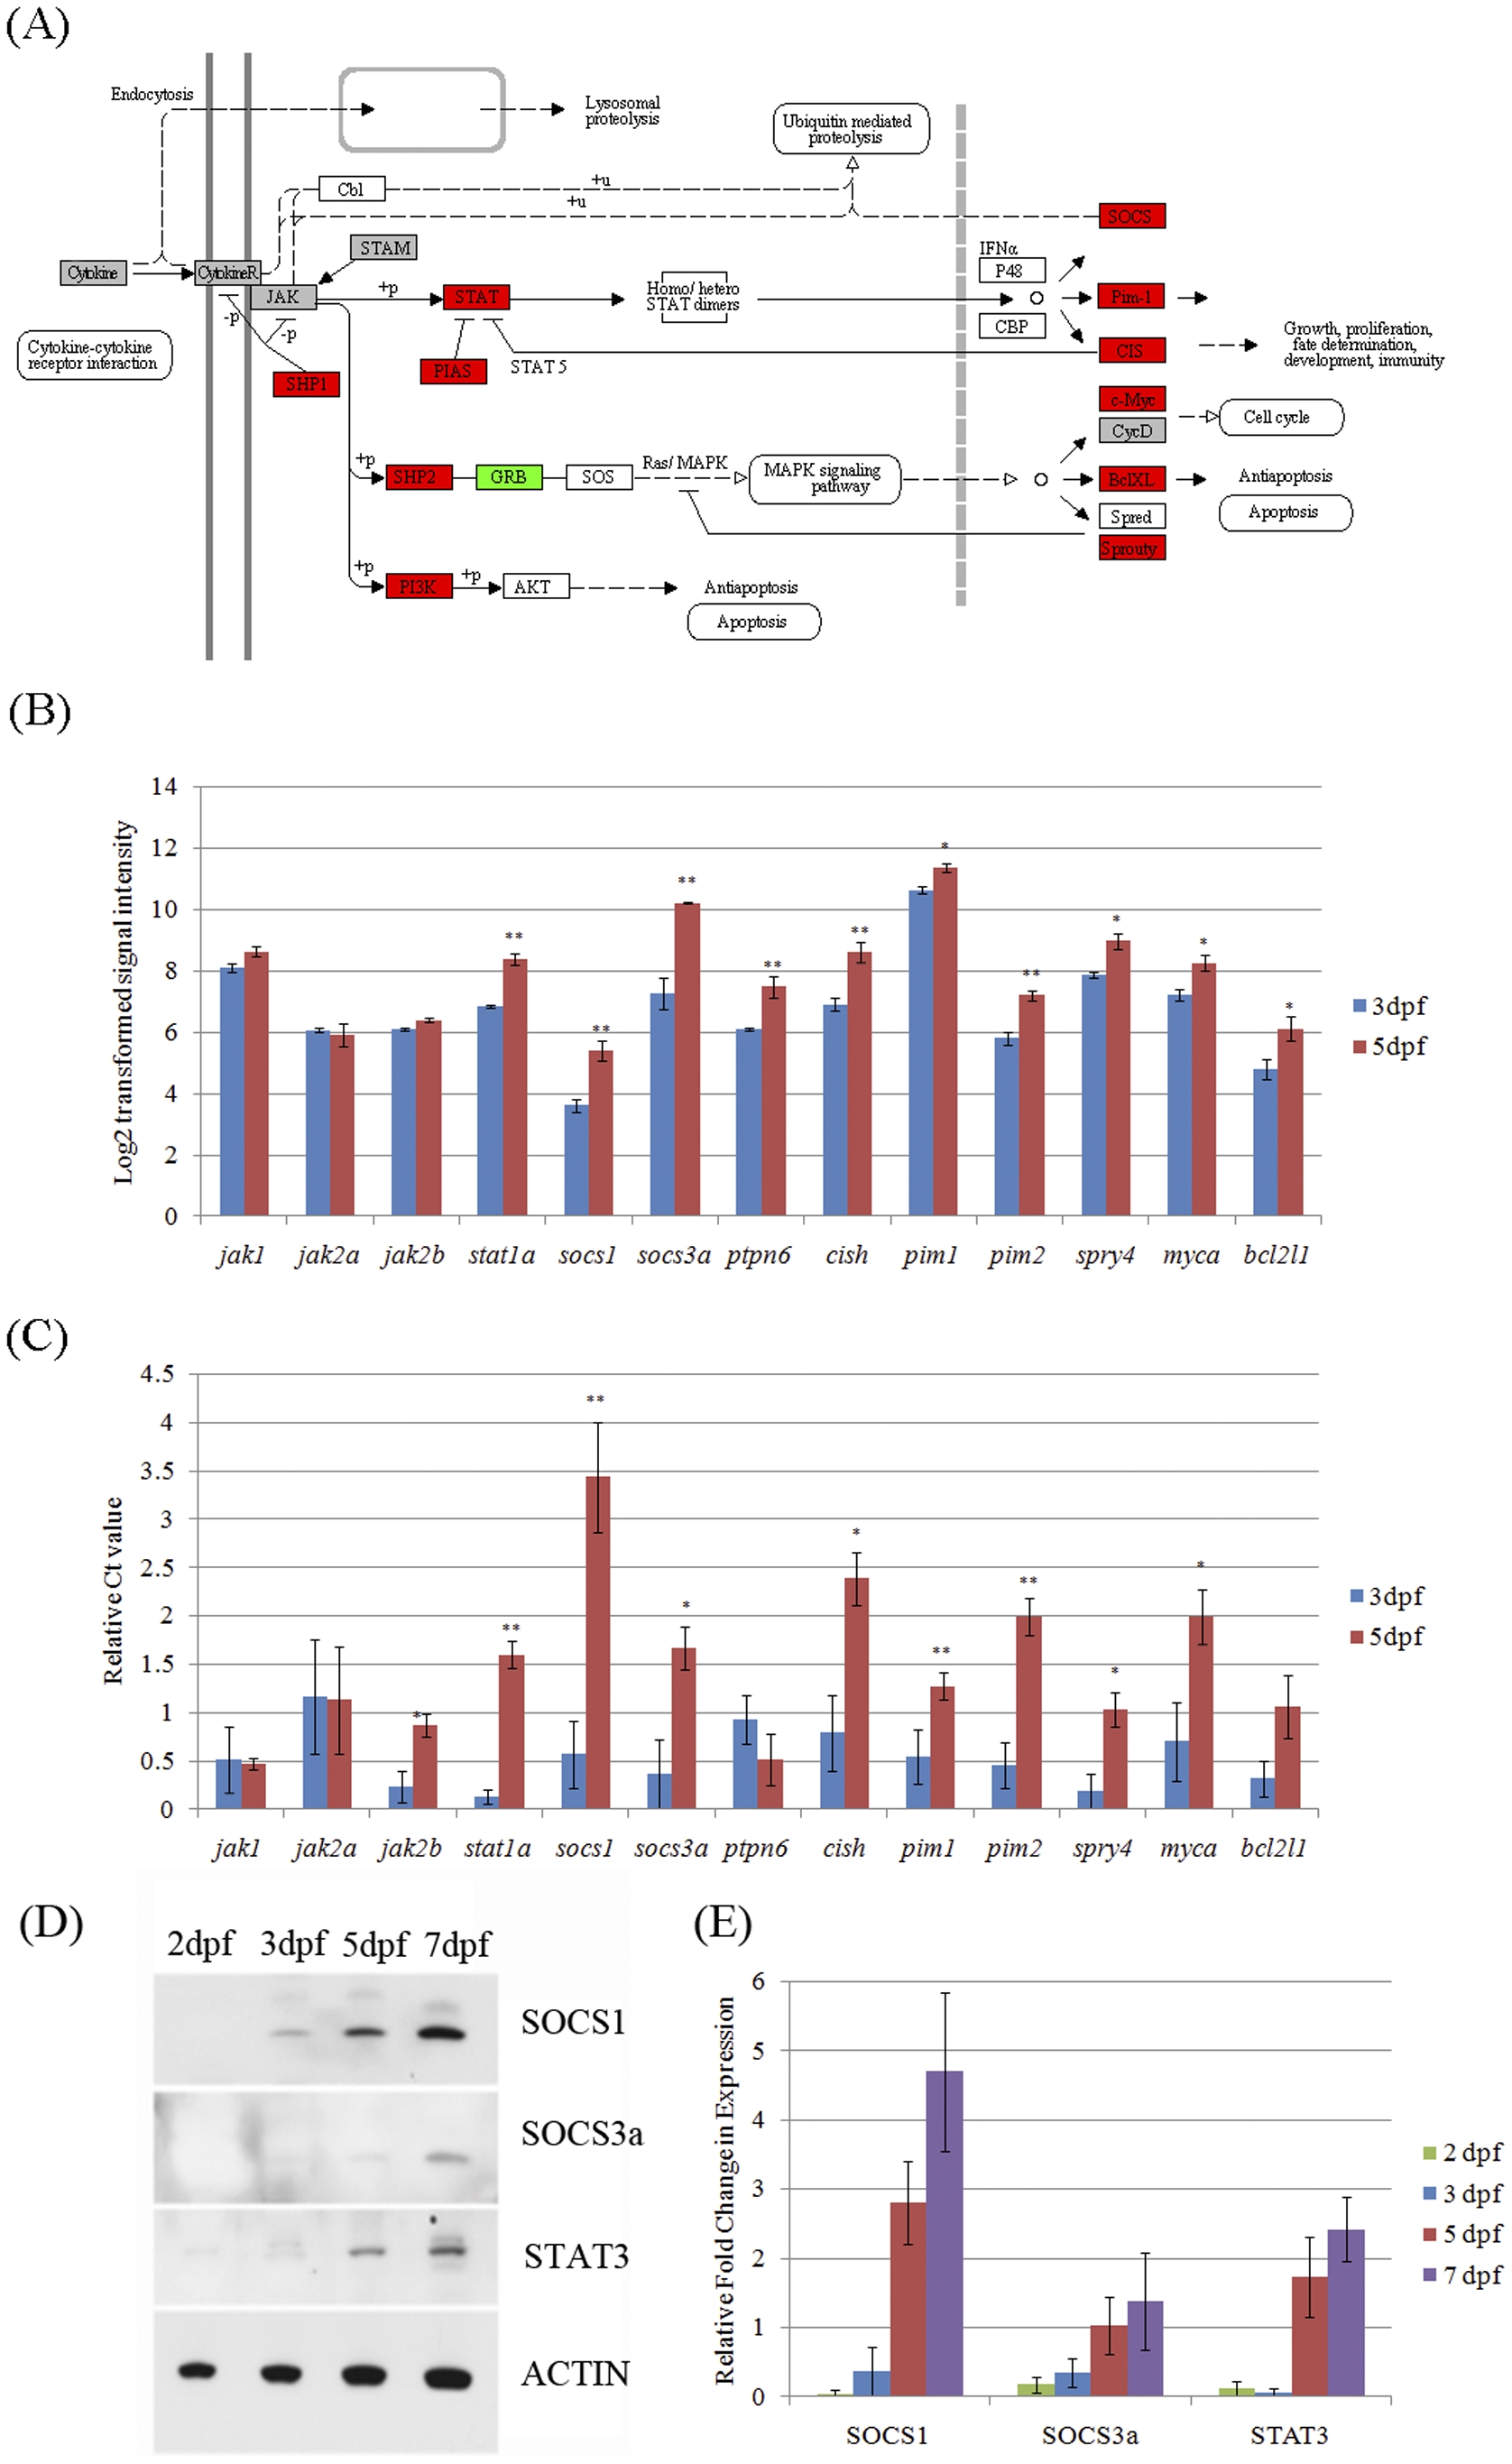
Up-regulation of gene and protein expression in the Jak-Stat signaling pathway from 3 to 5 dpf during eye development.
(A) Red blocks are up-regulated genes between 5 versus 3 dpf. Green blocks are down-regulated genes between 5 versus 3 dpf. Grey blocks are genes not changed between 5 versus 3 dpf. White blocks are genes not targeted by the microarray or not in the zebrafish genome. The gene interaction network figure is from the KEGG database with modification adapted to zebrafish genes. (B) Signal intensities on the microarrays. *: q-value<0.05. **: q-value<0.01. (C) Real-time PCR results are depicted as relative abundance compared to lowest abundance sample. *: p-value<0.05. **: p-value<0.01. (D) Western blot and (E) densitometric analysis of protein samples extracted from zebrafish whole larvae shows that Socs1, Socs3a and Stat3 expression are up-regulated from 2 to 7 dpf.