Fig. 3
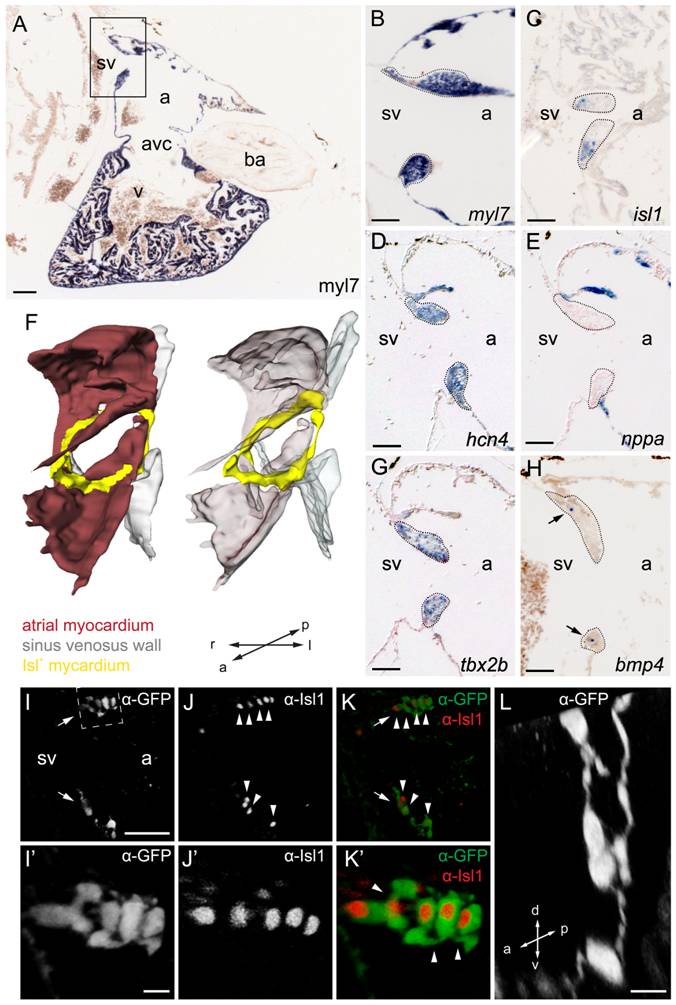
Fig. 3 Molecular characterization of the adult isl1 expression domain.
(A–E,G,H) Section in-situ hybridizations on adult wild-type zebrafish hearts. Probes are indicated in the panels. (A) 4-chamber view of a sagittal section through zebrafish heart labeled with the myocardial marker myl7. The box indicates the region shown enlarged in panels B–E,G,H. Demarcated areas (C) indicate isl1 expression in the tbx2b+ hcn4+ nppa- myocardium at the base of the valves surrounding the sinoatrial junction. BMP4 signal is pointed at in the valves by arrowheads in (H). (F) 3D reconstruction of the sinoatrial junction. isl1 (yellow) is expressed around the entire sinoatrial junction, forming a ring-like structure. (I–L) Reconstruction of a confocal scan through a sagittal section of the inflow region of adult Tg(isl1BAC:GalFF; UAS:GFP) transgenic zebrafish heart. Fluorescent antibody labeling for GFP (shown in grey (I, I′, L) or green (K, K′)) and for Isl1 (shown in grey (J, J′) or red (K, K′)). GFP+/Isl1+ cells were found in bilateral populations at the sinoatrial junction (arrows). (I′–K′) Enlargement of the GFP+/Isl1+ cells at the dorsal rim of the inflow tract (indicated with dashed box in (I)). Nuclei of GFP+ cells were positive for Isl1 (arrowheads). (L) Enlargement of GFP+ cells (transverse section) shows a string of contiguous cells. a, atrium; avc, atrioventricular canal; ba, bulbus arteriosus; sv, sinus venosus; v, ventricle; l, left; r, right; a, anterior; p, posterior; d, dorsal; v, ventral. Scale bars represent 50 μm (A–G, I–K) or 10 μm (I′–K′,L).

