
|
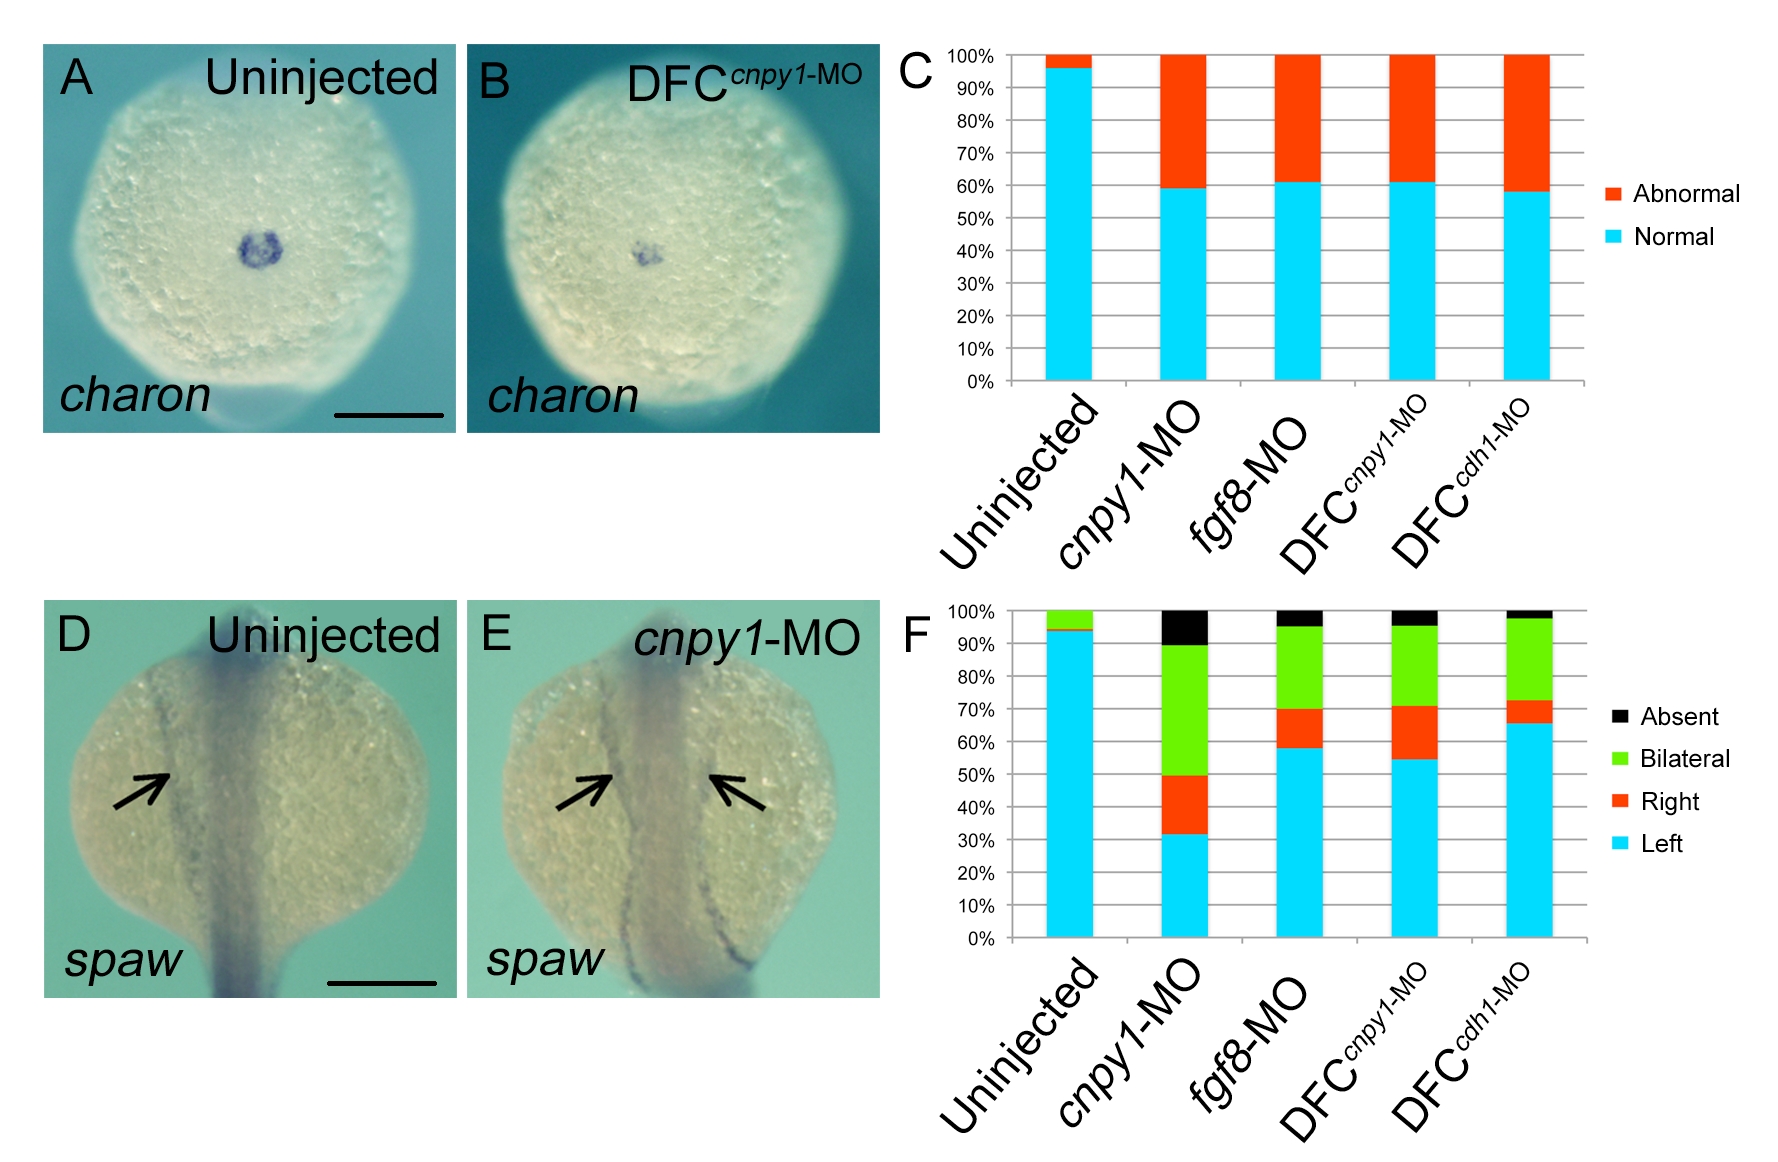
Fig. S6
Loss of FGF signaling leads to defects in KV formation and LR patterning. (A, B) Representative images showing horseshoe-shaped (uninjected; A) or abnormal (DFC cnpy1-MO; B) patterns of charon expression in embryos at the 6-somite stage. Vegetal pole view. Scale bar: 200 μm. (C) Percentages of normal or abnormal phenotypes were scored using the charon expression pattern in uninjected (n = 54), cnpy1-MO (n = 73), fgf8-MO (n = 66), DFCcnpy1-MO (n = 72) or DFCcdh1-MO (n = 71) embryos. Statistically significant (P < 0.05) differences could be seen in uninjected versus cnpy1-MO (P = 5.66 x 10⁻⁸), fgf8-MO (P = 4.99 x 10⁻⁷), DFCcnpy1-MO (P = 4.14 x 10⁻⁷) and DFCcdh1-MO (P = 6.40 x 10⁻⁸). (D, E) Representative images demonstrating left-sided (uninjected; D) or bilateral (cnpy1-MO; E) expression of spaw at the 20-somite stege. Dorsal view, anterior to the top. Scale bar: 200 μm. (F) Percentage of left-sided, right-sided, bilateral, or no (absent) expression of spaw in uninjected (n = 156), cnpy1-MO (n = 133), fgf8-MO (n = 108), DFCcnpy1-MO (n = 110) or DFCcdh1-MO (n = 84) embryos. Statistically significant (P < 0.05) differences could be seen in uninjected versus cnpy1-MO (P < 2.2 x 10⁻¹⁶), fgf8-MO (P = 4.96 x 10⁻¹⁶), DFCcnpy1-MO (P < 2.2 x 10⁻¹⁶) and DFCcdh1-MO (P = 9.21 x 10⁻¹¹).