
Fig. 7
|
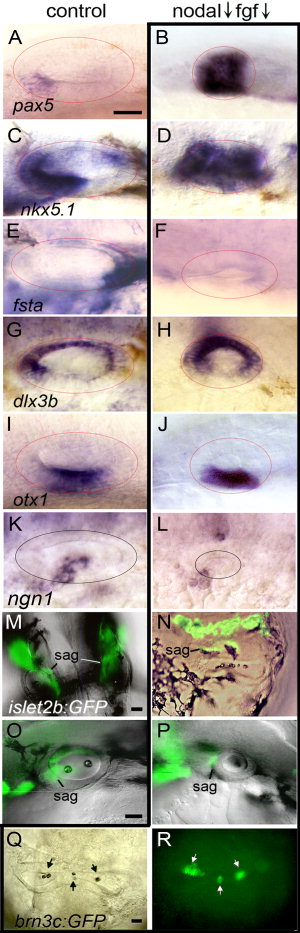
Fig. 7 Patterning within medial otic vesicles. Expression of various markers in control embryos, or wild-type embryos treated with 70 μM SB431542 + 1 μM SU5402. A–F: Expression of AP markers pax5 (A, B), nkx5.1 (C, D), and fsta (E, F). G–L: Expression of DV markers dlx3b (G, H), otx1 (I, J), and ngn1 (K, L). M–P: Fluorescence/DIC overlays showing cranial ganglia in live embryos at 28 hpf, as visualized by islet2b:GFP. Neurons of the statoacoustic ganglia (sag) are indicated. Q, R: Bright field and fluorescence images of a live inhibitor-treated specimen at 30 hpf reveals the presence of sensory epithelia, marked by otoliths (Q, arrows) and brn3c:GFP expression in hair cells (R, arrows). Images show lateral views with anterior to the left (A–L, O, and P) or dorsal views with anterior to top (M, N, Q, R). Scale bar = 25 μm.