
|
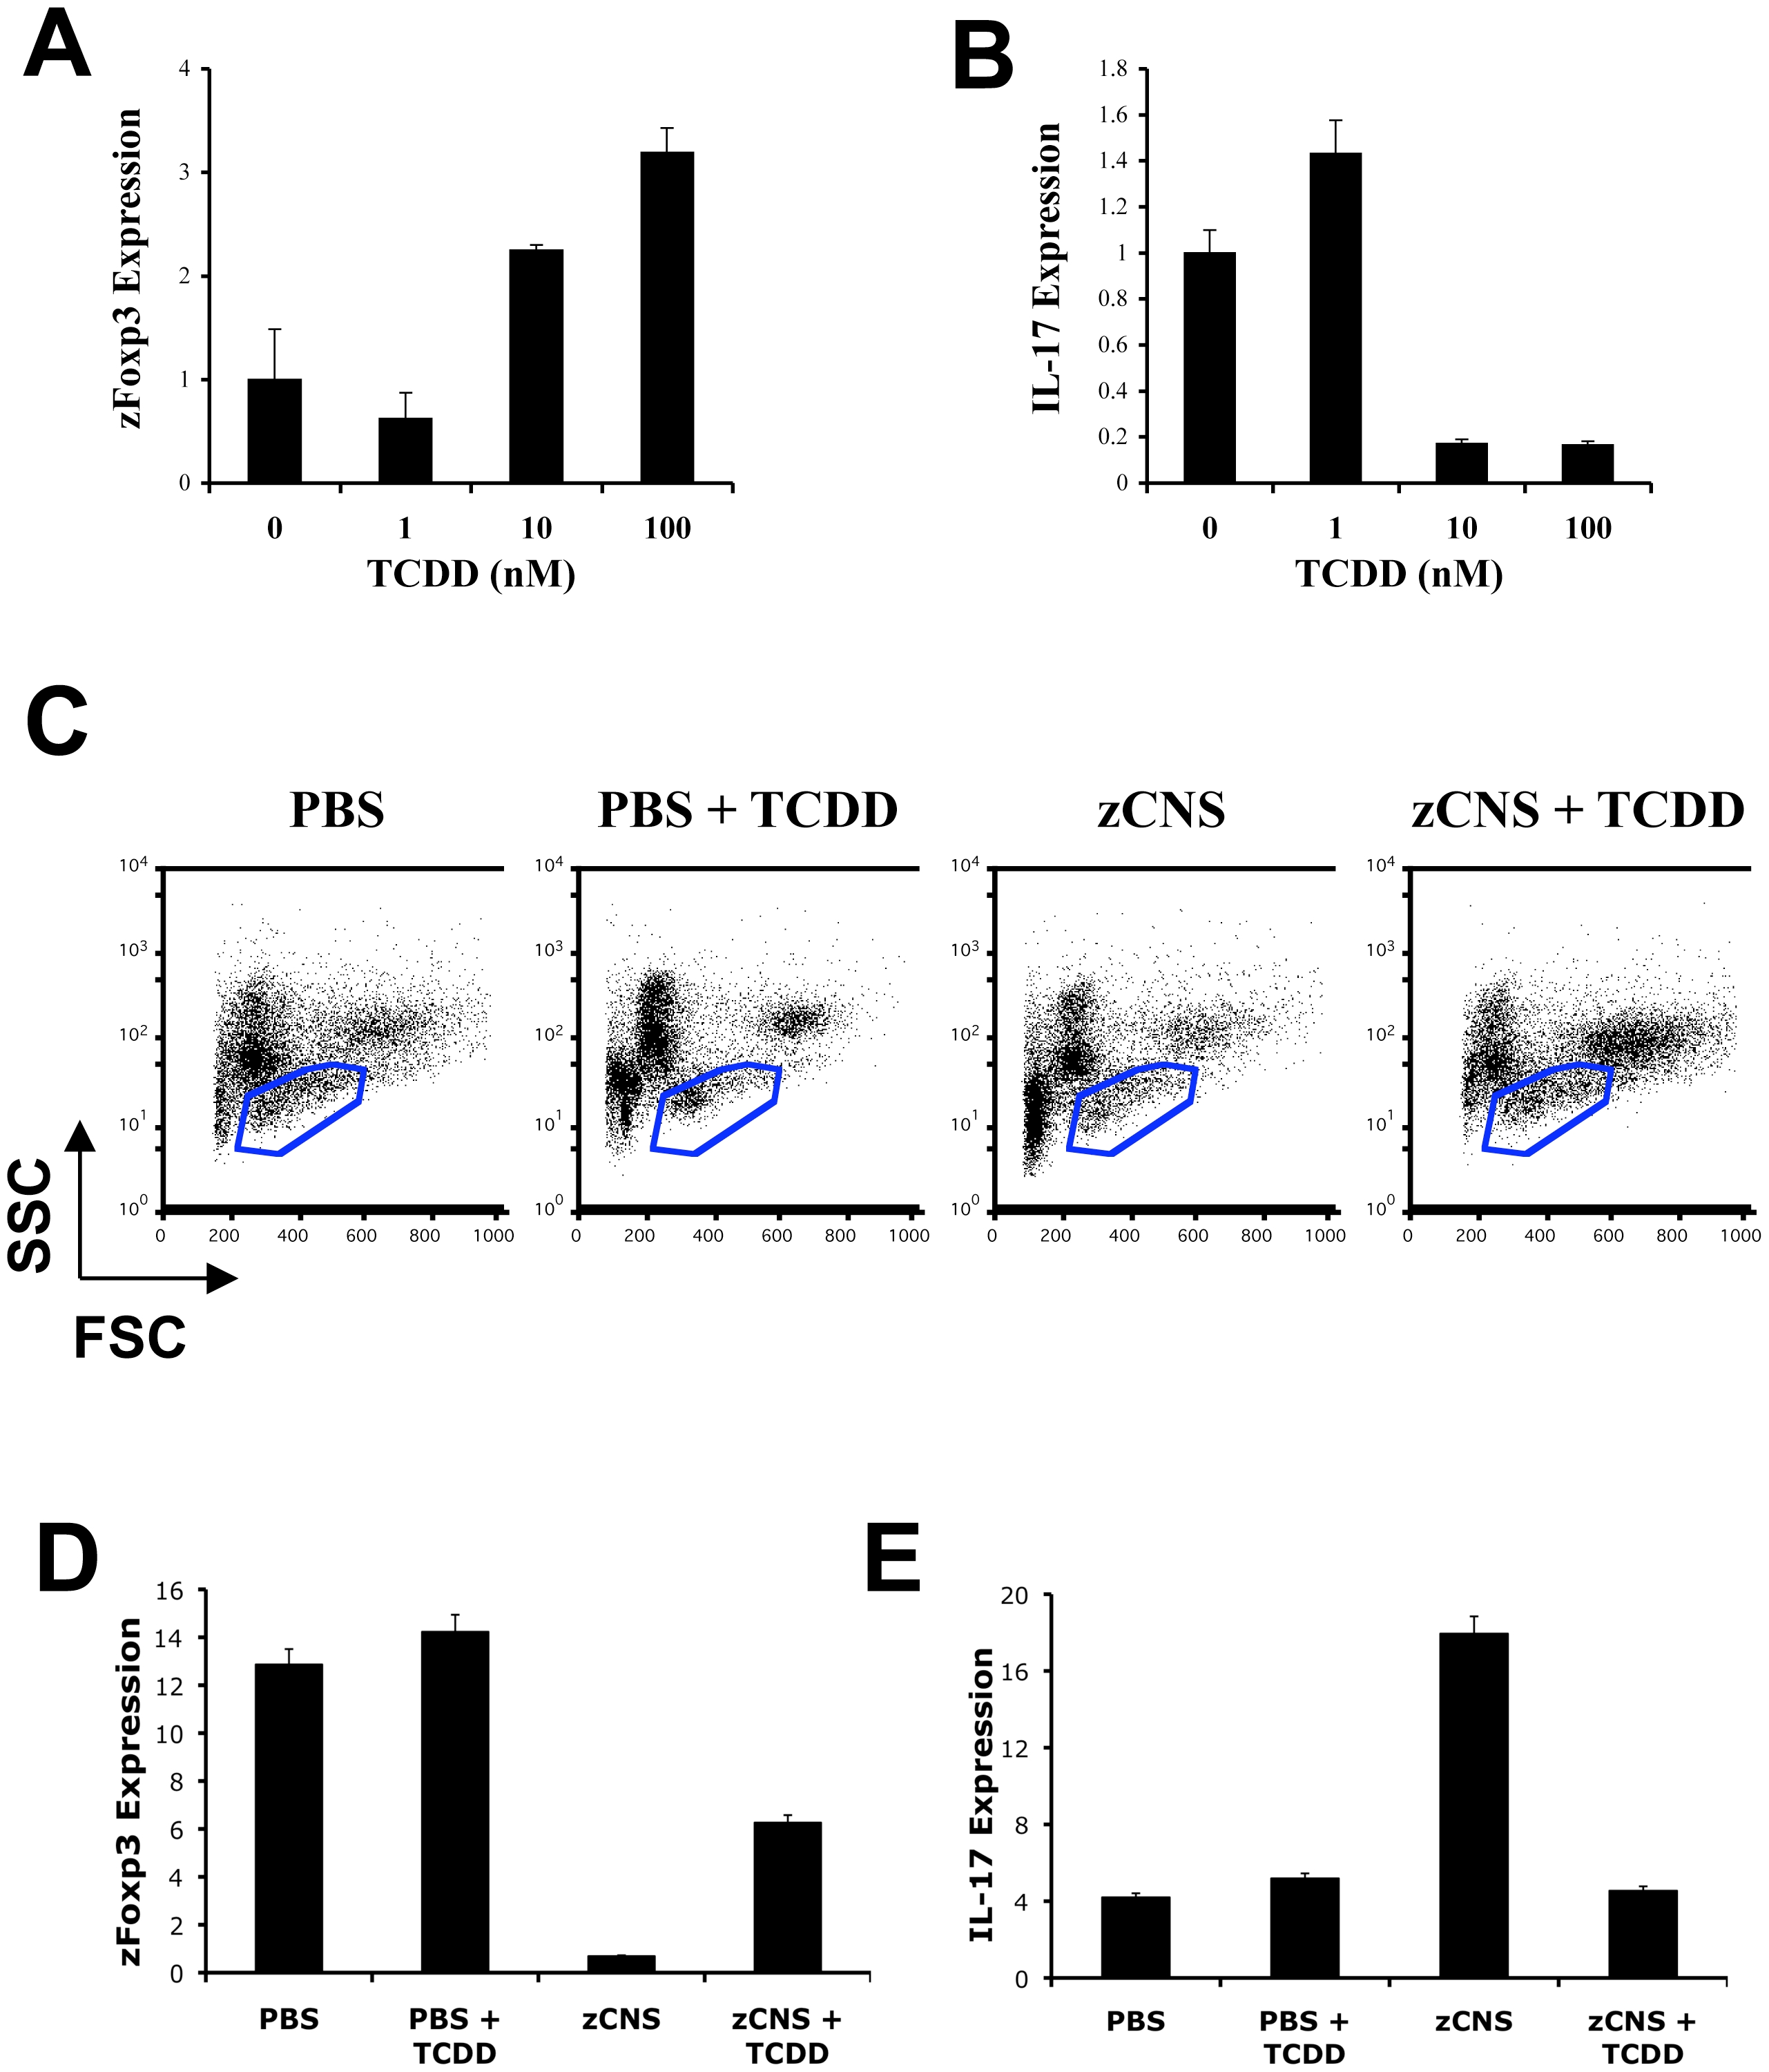
Fig. 4 AHR controls zFoxp3 expression.
(A,B) TCDD was added to the water of three-day post-fertilization zebrafish embryos, and 72 h later zFoxp3 (A) and IL-17 (B) expression were determined by real time PCR (mean + s.d. of triplicates normalized to GAPDH expression). Two independent experiments produced similar results. (C) Fourteen days after immunization, kidney cells from PBS or zCNS immunized zebrafish, or TCDD-treated zCNS immunized zebrafish were analyzed by FACS and cells in the lymphocyte fraction (blue gate) were sorted. (D–E) Expression of zFoxp3 and IL-17 measured by real-time PCR in FACS-sorted lymphocytes. Two independent experiments produced similar results.