Fig. 7
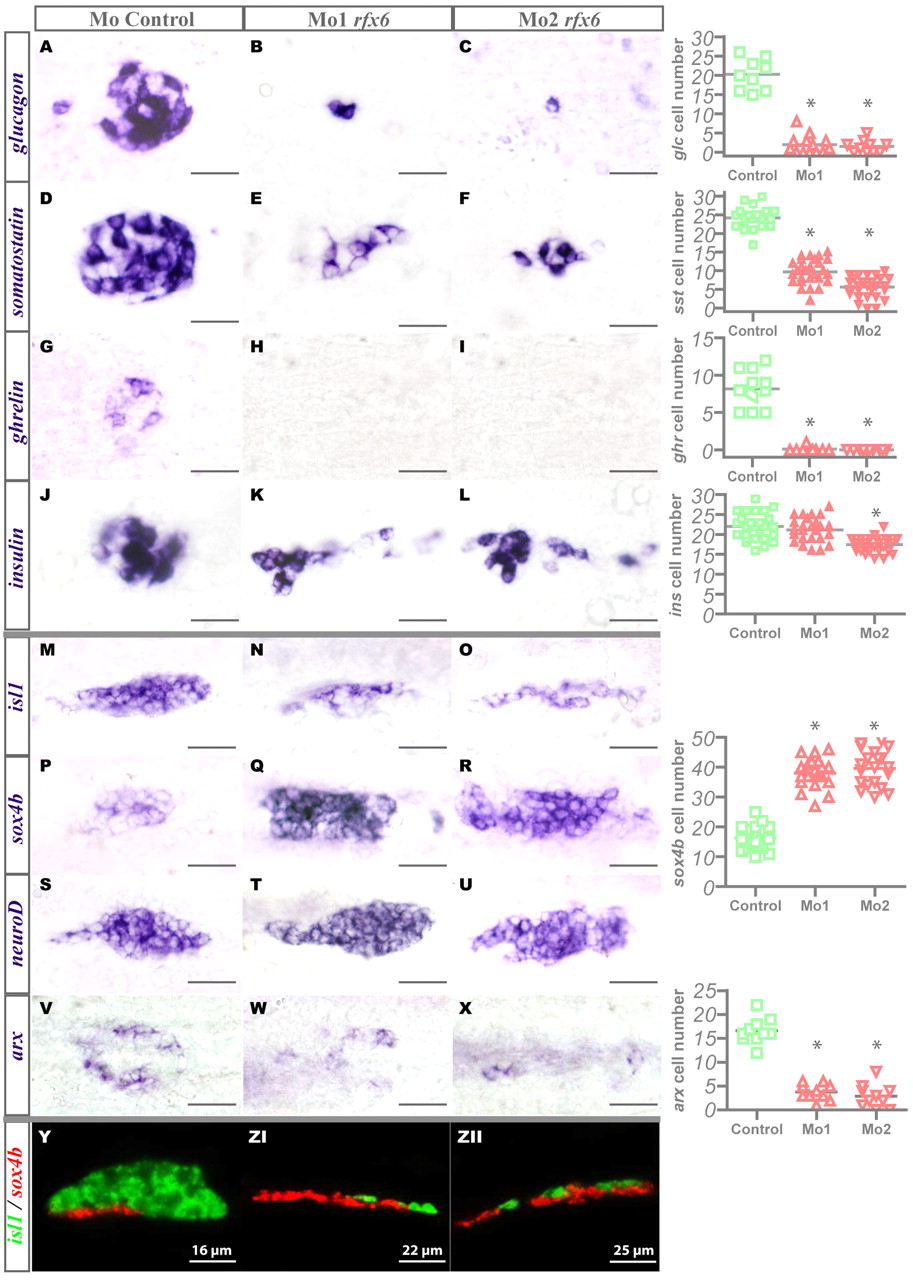
Fig. 7 Impaired endocrine cell differentiation, accumulation of islet progenitor cells and failure of insulin-expressing cells clustering in rfx6 morphants in the zebrafish. (A-X) Ventral views of the pancreas area from embryos analysed by WISH, anterior to the left. (A-L) Hormone expression in the control and rfx6 morphants at 30 hpf. (M-X) Pancreatic expression of isl1, sox4b and neuroD at 24 hpf and arx at 30 hpf in the control and rfx6 morphants. (Y-ZII) Lateral views of the pancreas area from 30 hpf embryos analysed by double-fluorescent WISH for sox4b and isl1, anterior to the left, dorsal to the top. Quantifications (right side of figure) represent the number of positive cells per embryo for controls and morphants. Asterisks (*) indicate that the difference between cell number in control and morphants is statistically significant by Student′s t-test (P<0.001). Scale bar: 14 μm in A-L; 18 μm in M-X.

