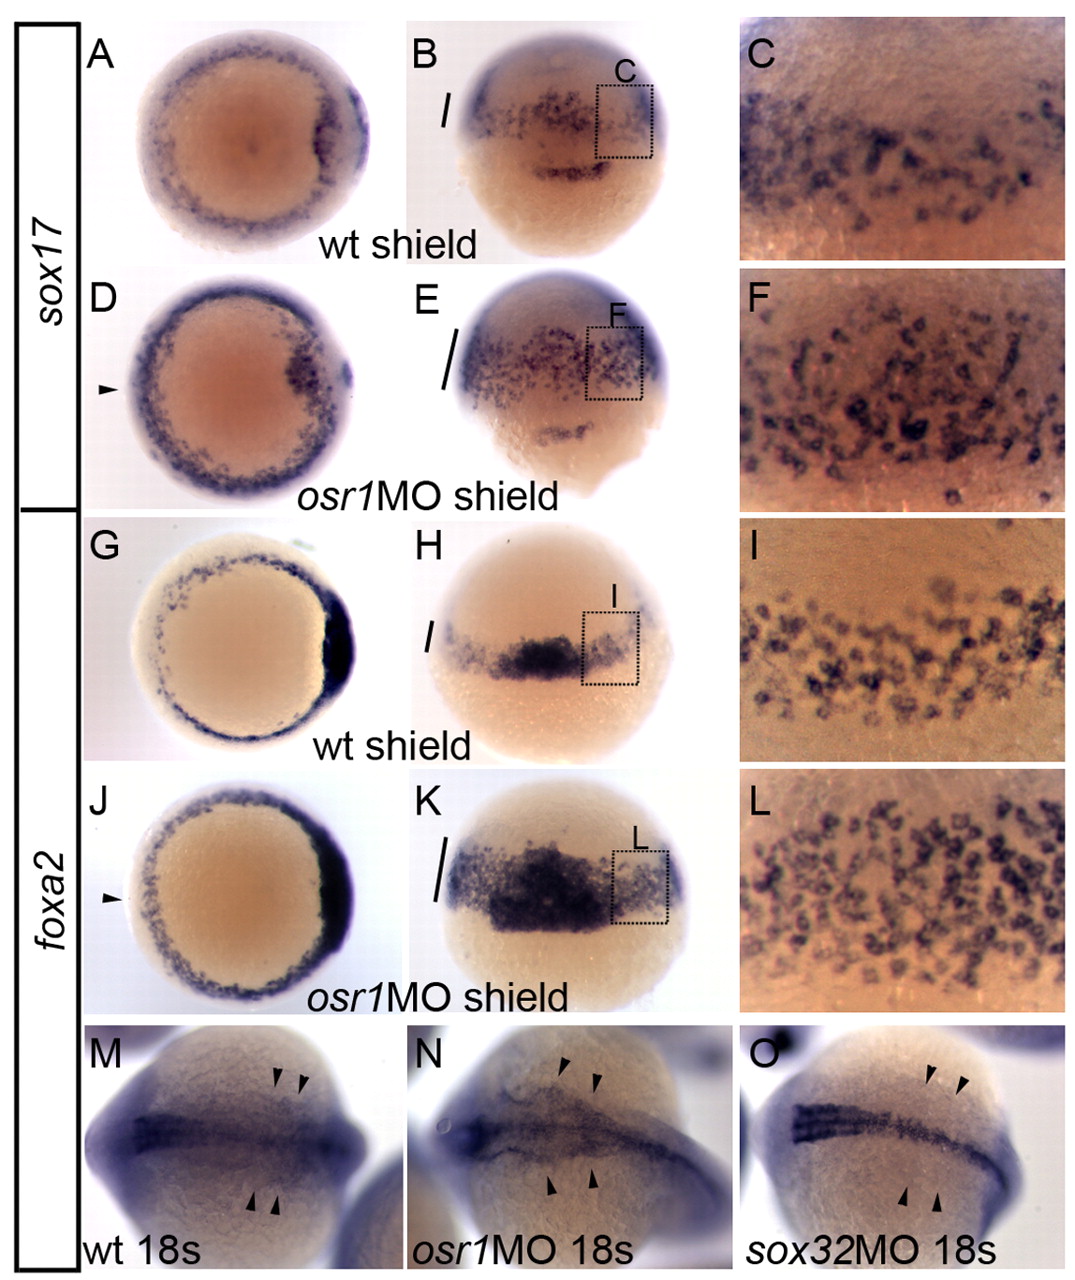
Fig. 10 osr1 knockdown causes expansion of endoderm. (A-F) Expression of endoderm marker sox17 in control (A-C) and osr1 morphants (D-F) at the shield stage. (A,D) Dorsal views; (B,E) side views with dorsal facing; (C,F) magnified views of boxed regions in B,E, respectively. The number of tiers of sox17-expressing cells was significantly increased in osr1 morphants at the blastoderm margin (bar in E,F) and in the ventral region of the embryo (arrowhead, D) when compared with control (A,C; bar in B). (G-L) Expression of mesendoderm marker, foxa2 in control (G-I) and osr1 morphants (J-L) at the shield stage. (G,J) Dorsal views; (H,K) side views with dorsal facing; (I,L) magnified views of boxed regions in H,K, respectively. The number of tiers of foxa2-expressing cells were significantly increased in osr1 morphants with more layers of foxa2-expressing cells at the blastoderm margin (bar in K,L) and enhanced expression in the ventral region of the embryo (arrowhead, J) when compared with control (G,I; bar in H). (M-O) Expression of foxa2 at 18 somites in control (M), osr1 morphants (N) and sox32 (cas) morphants (O). Development of foxa2-positive pharyngeal endoderm was enhanced in osr1 morphants (arrowheads, N) when compared with control embryos (arrowheads, M) and was completely blocked by sox32 knockdown (arrowheads, O).
Image
Figure Caption
Figure Data
Acknowledgments
This image is the copyrighted work of the attributed author or publisher, and
ZFIN has permission only to display this image to its users.
Additional permissions should be obtained from the applicable author or publisher of the image.
Full text @ Development

