Image
Figure Caption
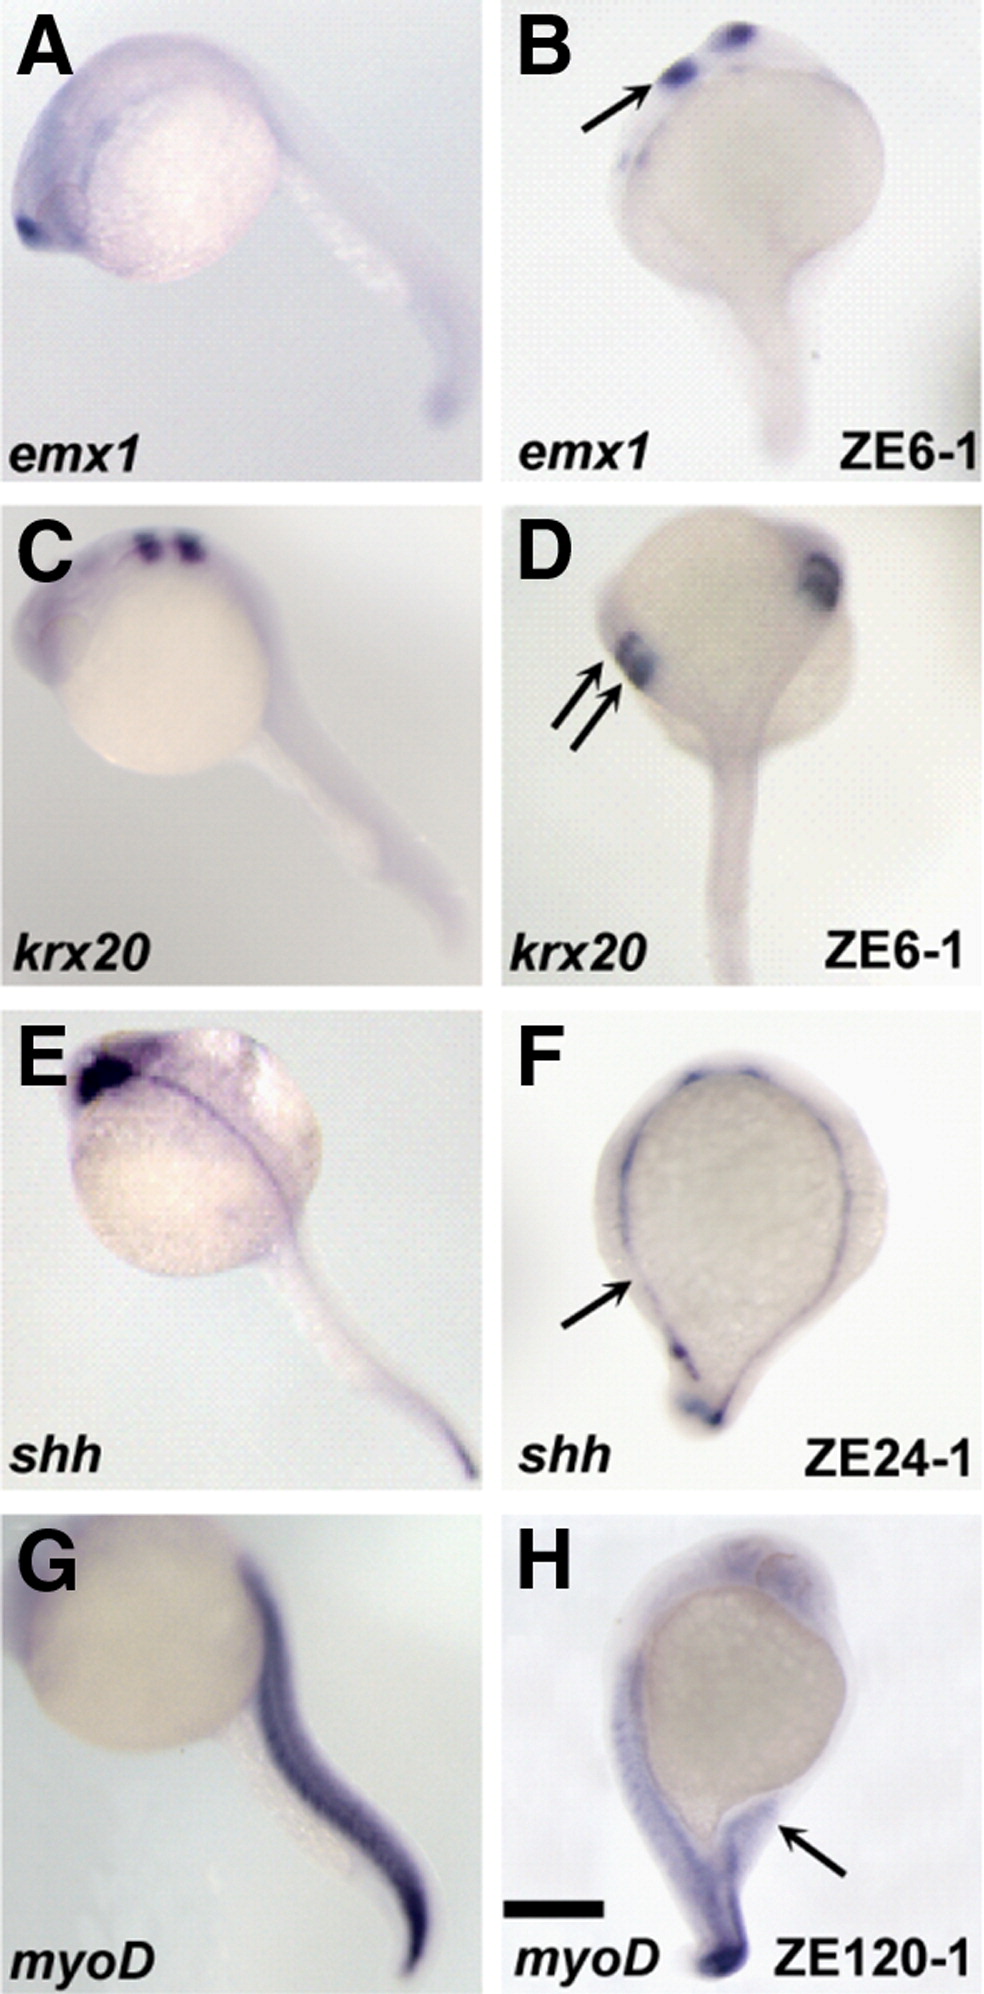
Fig. 1 Expression of specific marker genes in the secondary axis. (A, B) Dorsal telencephalic marker gene emx1. (C, D) Rhombomere 3 and 5 marker gene krx20. (E, F) Floor plate marker gene shh. (G, H) Somite marker gene myoD. (A, C, E, G) Control, non-implanted embryos. (B, D, F, H) cell-implanted embryos. The secondary axis had a visible notochord. (A–C, F–H) Lateral views. (D, E) Dorsal views. All embryos are at the pharyngula stage (24 hpf). Arrows indicate the ectopic expression of the marker gene inthe secondary axis. Scale bar, 100 μm.
Figure Data
Acknowledgments
This image is the copyrighted work of the attributed author or publisher, and
ZFIN has permission only to display this image to its users.
Additional permissions should be obtained from the applicable author or publisher of the image.
Reprinted from Developmental Biology, 321(2), Hashiguchi, M., Shinya, M., Tokumoto, M., and Sakai, N., Nodal/Bozozok-independent induction of the dorsal organizer by zebrafish cell lines, 387-396, Copyright (2008) with permission from Elsevier. Full text @ Dev. Biol.

