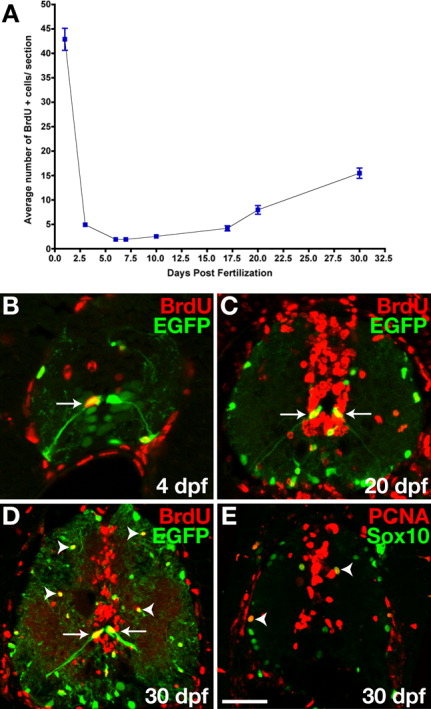
Fig. 3 olig2+ spinal cord cells divide at postembryonic stages. All images are single confocal optical sections of transverse sections of 30 dpf Tg(olig2:egfp) zebrafish spinal cords, dorsal up. A: Graph showing average number of BrdU+ spinal cord cells per transverse section at different embryonic and postembryonic stages. Data were compiled from 15-30 sections per timepoint. Bars represent standard error of the mean. B: 4 dpf Tg(olig2:egfp) transgenic larvae pulse-treated with BrdU and labeled with anti-BrdU antibody. Arrows indicate EGFP+ radial glia, which incorporated BrdU. C,D: Twenty- and 30-dpf Tg(olig2:egfp) transgenic fish treated with BrdU repeatedly. Many cells, including EGFP+ radial glia (arrows), bordering the central canal and medial septum incorporated BrdU. Some EGFP+ oligodendrocyte lineage cells were also BrdU+ (arrowheads). E: Double labeling with anti-Sox10 and anti-PCNA antibodies. Sox10+ PCNA+ cells were proliferative OPCs (arrowheads). Scale bar = 30 μM (B,C), 50 μM (D,E).
Image
Figure Caption
Figure Data
Acknowledgments
This image is the copyrighted work of the attributed author or publisher, and
ZFIN has permission only to display this image to its users.
Additional permissions should be obtained from the applicable author or publisher of the image.
Full text @ Dev. Dyn.

