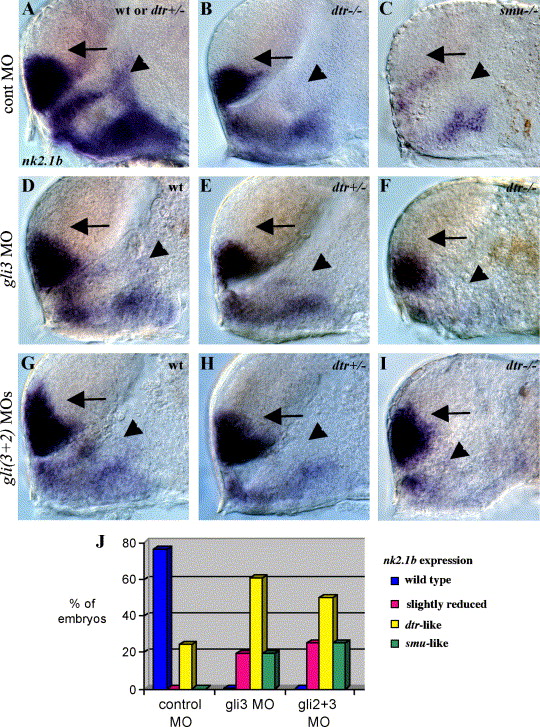
Fig. 6 Regulation of nk2.1b expression by Gli3, Gli1, and Gli2. (A) nk2.1b expression in the forebrain is identical in wild-type and dtr(gli1)+/- heterozygous embryos. (B) dtr(gli1)-/- mutants have reduced nk2.1b expression in the dorsal diencephalon adjacent to the telencephalon (arrowhead). (C) smu(smo) mutant with greatly reduced nk2.1b expression in both the telencephalon and diencephalon. (D, E, F) gli3MO (10 ng) injected into a clutch of embryos from dtr(gli1)+/- heterozygous parents yielded 6 (26%) wild-type embryos which had a slight reduction of nk2.1b in the dorsal diencephalon (D, arrowhead), 10 (44%) heterozygous dtr(gli1)+/- embryos which had a dtr(gli1) mutant-like loss of nk2.1b expression in the dorsal diencephalon (E, arrowhead), and 7 (30%) dtr(gli1)-/- mutant embryos which had greatly reduced diencephalic nk2.1b expression (F, arrowhead) similar to phenotype seen in smu(smo) mutants. (G, H, I) Coinjection of gli3MOs and gli2MOs into a clutch of embryos from dtr(gli1)+/- heterozygous parents resulted in a slight reduction of diencephalic nk2.1b expression in 6 (25%) embryos (G, arrowhead), a dtr(gli1)-/- mutant-like reduction of nk2.1b expression in 12 (50%) embryos (dtr(gli1)+/- heterozygotes) (H, arrowhead), and greatly reduced diencephalic nk2.1b expression in 6 (25%) embryos (dtr(gli1)-/- mutants) (I, arrowhead). Double MO injections led to dorsal expansion of nk2.1b in the telencephalon (arrows in G, H, I), as shown previously for gli2MOs (Karlstrom et al., 2003). All panels show 30-h embryos, side views of the forebrain, eyes and yolk removed, anterior to the left. Genotype was determined by comparing defects in marker gene expression. (J) Graph showing percentages of injected embryos with different nk2.1b expression patterns.
Reprinted from Developmental Biology, 277(2), Tyurina, O.V., Guner, B., Popova, E., Feng, J., Schier, A.F., Kohtz, J.D., and Karlstrom, R.O., Zebrafish Gli3 functions as both an activator and a repressor in Hedgehog signaling, 537-556, Copyright (2005) with permission from Elsevier. Full text @ Dev. Biol.

