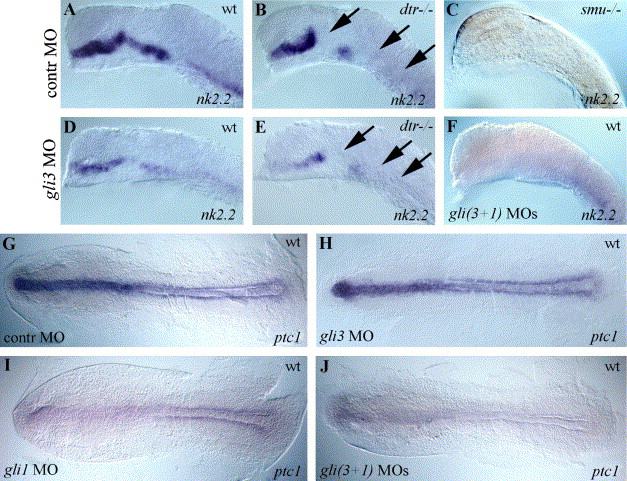
Fig. 5 Positive regulation of nk2.2 and ptc1 expression by Gli3 and Gli1. (A) Wild-type nk2.2 expression in a control MO-injected zebrafish embryo. (B) In dtr(gli1) mutants nk2.2, expression is regionally absent (arrows). (C) smu(smo) mutants have no nk2.2 expression at 19 h. (D, E) gli3MO injections generally decreased nk2.2 expression in wild-type embryos (D) and further reduced nk2.2 expression in dtr(gli1) mutants (E, arrows). (F) Coinjections of gli3MO and gli1MO produced a smu(smo)-like phenotype with no nk2.2 expression. (G) ptc1 expression was not affected by control MO injections. (H) gli3MO injections had little or no effect on ptc1 expression. (I) gli1MO injections reduced expression of ptc1. (J) Coinjection of gli3MO and gli1MO reduced ptc1 expression almost completely. (A–F) lateral views of 19-h embryos, eyes and yolks removed, anterior to the left. (G–J) Dorsal views of 11-h embryos, anterior to the left, yolks removed.
Reprinted from Developmental Biology, 277(2), Tyurina, O.V., Guner, B., Popova, E., Feng, J., Schier, A.F., Kohtz, J.D., and Karlstrom, R.O., Zebrafish Gli3 functions as both an activator and a repressor in Hedgehog signaling, 537-556, Copyright (2005) with permission from Elsevier. Full text @ Dev. Biol.

