Fig. 2
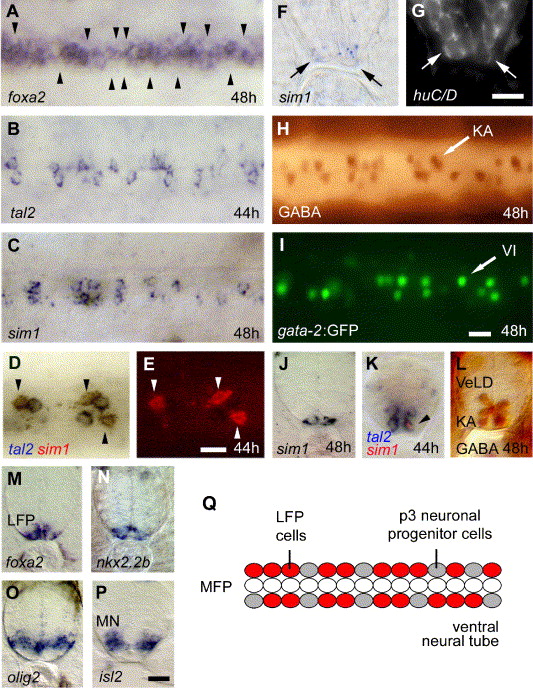
Fig. 2 Two different cell populations alternate in the zebrafish ventral neural tube. (A, B) At 48 hpf, foxa2 is discontinuously expressed in cells adjacent to the MFP (A). tal2 expression is weakly detectable in single cells at 44 hpf (B). Arrowheads in panel (A) indicate regions with no detectable expression of foxa2. (C) sim1 is expressed in groups of cells located adjacent to the MFP, which are discontinuously distributed along the AP axis, similar to tal2 in panel B. (D, E) Some sim1-positive cells (in red in D and E) co-express tal2 (in blue in D, indicated by arrowheads). (F–G) sim1-expressing cells (F) are positive for the neuronal marker huC/D (G). The same transverse section is shown for bright-field (F) and Cy3 fluorescence (H). (H, I) GABA protein in wild-type (H) and gata-2 gene expression in gata-2:GFP transgenic embryos (I). Focal plane shows the most ventral cells of the neural tube and depicts Kolmer–Agdhur (KA) neurons and ventral interneurons (VI), respectively, in the ventral-most domain (also shown in transverse section in panel L). Note similar expression of tal2 (B), sim1 (C), GABA (H) and gata-2 (I). Panels A–E and H, I are dorsal views of trunk, anterior to the left. (J–N) Transverse sections showing co-expression of sim1 (J), tal2 (in blue) and sim1 (in red; K), GABA (L), foxa2 (M) and nkx2.2b (N) in the ventral neural tube. (O, P) Expression of olig2 in the motoneuronal domain (M) and isl2 in differentiated motoneurons (N) is located adjacent to markers detected in panels J–N. (Q) Model of the zebrafish ventral neural tube during early neurogenesis in which non-neuronal LFP (foxa2+, nkx2.2b+) and p3 neuronal progenitor cells (tal2+, nkx2.2b+) alternate along the AP axis in cells adjacent to the MFP. Panels F, G and J–P are transverse sections of middle trunk regions. VI, ventral interneurons; KA, Kolmer–Agdhur neurons; MN, motoneurons; VeLD, ventral lateral distal neurons. Scale bars: E,G 5 μM; I,P 10 μM.
Reprinted from Developmental Biology, 301(1), Schafer, M., Kinzel, D., and Winkler, C., Discontinuous organization and specification of the lateral floor plate in zebrafish, 117-129, Copyright (2007) with permission from Elsevier. Full text @ Dev. Biol.

