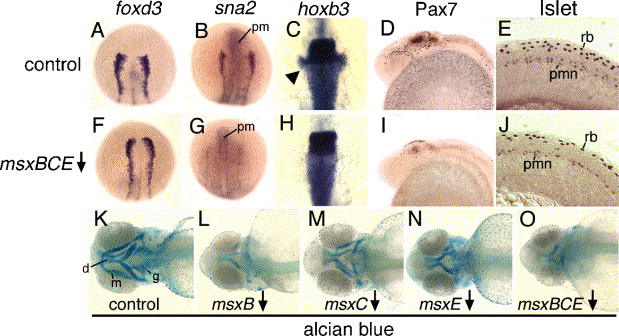
Fig. 6 Impaired neural crest development in msxBCE morphants. (A, F) foxd3 expression at 11 hpf in a control embryo (A) and msxBCE morphant (F). (B, G) snail2 expression at 11 hpf in a control embryo (B) and msxBCE morphant (G). (C, H) hoxb3 expression at 14 hpf in a control embryo a control embryo (C) and msxBCE morphant (H). Arrowhead shows neural crest cells migrating from the hindbrain. (D, I) Anti-Pax7 staining at 24 hpf in a control embryo (D) and msxBCE morphant (I). (E, J) Staining with 39.4D5 antibody reveals Islet1 and 2 in the trunk region at 19 hpf in a control embryo (E) and an msxBCE morphant (J). Rohon–Beard sensory neurons (rb) and primary motoneurons (pmn) are indicated. (K–O) Alcian blue cartilage staining at 75 hpf embryos knocked down for the indicated genes. Abbreviations: d, dorsal palate; g, gill arches; m, mandibular cartilage; pm, prechordal mesoderm. Images show dorsal views with anterior up (A–C, F–H), lateral views with dorsal up and anterior to the left (D, E, I, J) and ventral views with anterior to the left (K–O).
Reprinted from Developmental Biology, 294(2), Phillips, B.T., Kwon, H.J., Melton, C., Houghtaling, P., Fritz, A., and Riley, B.B., Zebrafish msxB, msxC and msxE function together to refine the neural-nonneural border and regulate cranial placodes and neural crest development, 376-390, Copyright (2006) with permission from Elsevier. Full text @ Dev. Biol.

