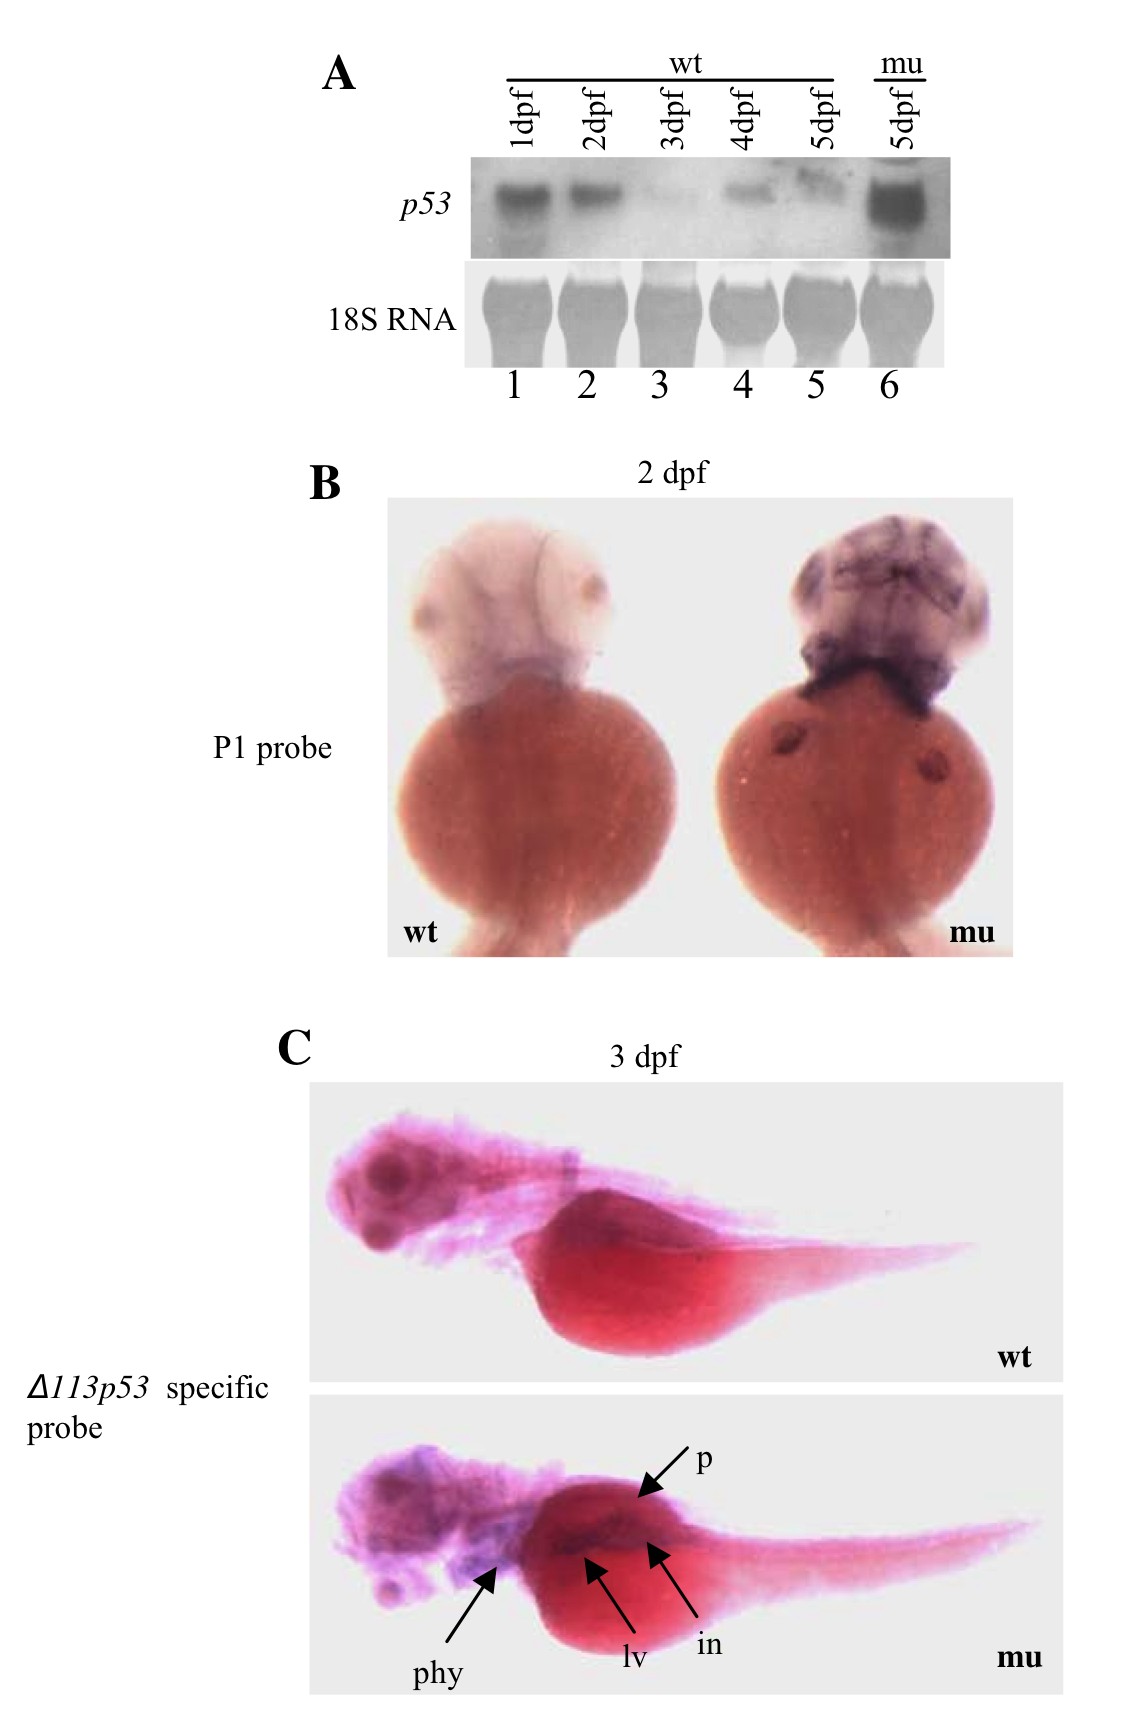
Fig. S1 Expression of {delta}113p53 is selectively up-regulated in the defhi429 mutant. (A) RNA gel blot hybridization showed that p53 expression in the wild type peaked at 1 dpf and then gradually reduced to a lower level at 5 dpf (lanes 1 to 5). On the other hand, at 5 dpf, a short p53 isoform ({delta}113p53) (red arrow) rather than the wild type p53 (black arrow) expressed at a very high level in the defhi429 mutant (mu) (lane 6). (B) In situ hybridization using P1 probe as in Fig. 5D showed elevated expression of {delta}113p53 in the defhi429 mutant phenocopies the expression pattern displayed by def (Fig. 4C) at 2 dpf. wt: wild type; mu: mutant. (C) In situ hybridization using an {delta}113p53 specific probe (269 bp) derived from intron 4 (forward primer: 5′-CAGTGGAGGTTGAACATGTCT-3′; reverse primer: 5′-CCTCCTGGTCTTGTAATGTCAC-3′) containing the transcribed 143 bp in {delta}113p53 showed that the expression of {delta}113p53 is specifically enriched in the digestive organs in the defhi429 mutant. wt: wild type; mu: mutant; in: intestine tube; lv: liver; p: pancreas; phy: pharyngeal.
Image
Figure Caption
Figure Data
Acknowledgments
This image is the copyrighted work of the attributed author or publisher, and
ZFIN has permission only to display this image to its users.
Additional permissions should be obtained from the applicable author or publisher of the image.
In addition, ZFIN would like to thank the authors for kindly granting us permission to reproduce their figures.
Full text @ Genes & Dev.

