
|
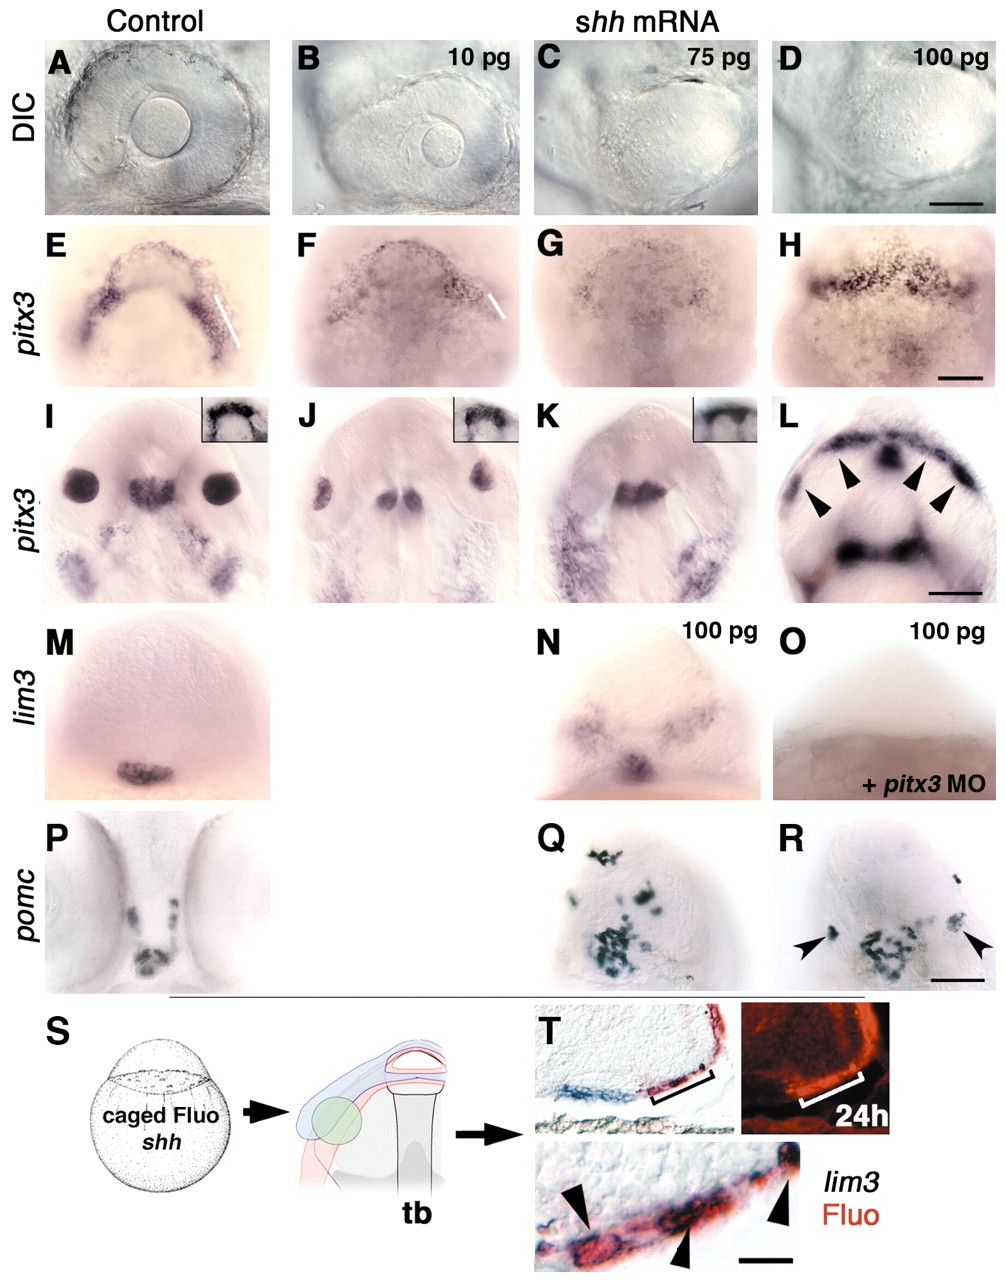
Fig. 7 Hedgehog can block lens formation and induce gene expression characteristic of pituitary cell types. (A-L) Increasing amounts (10, 75 and 100 pg) of injected shh mRNA affect lens size at prim-5 stage (A-D) and pitx3 gene expression at bud (E-H) and prim-5 (I-L) stages in a dose-dependent manner. (B,J) Reduced lens size (n=54/60). (C,K; n=52/60; D,L; n=93/99) Absence of lens tissue. (I-K) Pituitary placode size at prim-5 stage is unaffected by hedgehog mRNA (I-K insets; n=93/99). (E-G) At bud stage, progressive loss of pitx3 expression in presumptive lens precursors (bars; F, n=10/14; G, n=11/12) correlates with loss of lens tissue at prim-5 stage (B,C,J,K). (L) Ectopic pitx3 expression following injections of 100 pg shh mRNA per embryo at bud stage in anterior ventral ectoderm (H, 8/8) and at prim-5 stage (L, arrowheads; n=15/23). (M,N;P-R) shh mRNA induces ectopic lim3 (N; n=30/36) and pomc (Q,R; n=26/32). (Q) Ectopic pomc-expressing cells are scattered around forebrain (n=19/26) or (R, n=7/26) form small lens like structures (arrowheads). (O) Co-injection of pitx3 morpholino (8 ng/embryo) and shh mRNA (100 pg) leads to loss of lim3 expression in pituitary and ectopic lim3-expressing regions (n=28/30). (S) One-cell stage embryos injected with shh mRNA and caged fluorescein (n=27). Photoactivated spot of cells (green) at bud stage in the lens-forming region. (T) In shh mRNA-injected embryos, ectopic lim3 (n=9)-expressing cells (blue) were also labeled with uncaged fluorescein (red, arrowheads). Upper left and lower (magnification of upper left) panels, Nomarski images; upper right panel, fluorescence micrograph of same region showing fast red fluorescence in ectopic lim3-expressing cell. (A-D) Side views, anterior towards the left, dorsal towards the top. (I-L, insets) Dorsal views, anterior towards the top. (E-H) View of prospective head region (animal pole), ventral towards the top. (M-R) Frontal views, dorsal towards the top. (T) prim-5 stage embryo, transverse cryosection (16 µm thickness) through ventral forebrain. Scale bars: 50 µm in A-D; 100 µm in E-L, insets, M-R; 12.5 µm in T, lower panel.