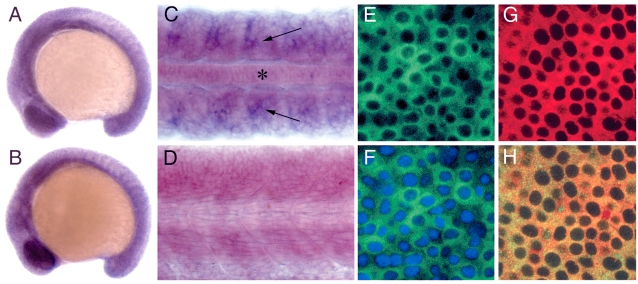
Fig. 2 Expression pattern of the zebrafish cos2 gene and subcellular distribution of the Cos2 protein. (A) cos2 expression in a 12-somite stage embryo derived from a cross of heterozygous smub641 parent fish. The expression is indistinguishable in wild-type embryos and their homozygous mutant smu siblings. (B) cos2 expression in a 12-somite stage wild-type embryo injected with Shh mRNA. (C) Flat mount of a 15 somite wild-type embryo with uniform expression of cos2 in somitic cells (arrows) and the midline (asterisk). (D) Lateral view of the myotome of a wild-type embryo at 24 hours post fertilisation (hpf) showing cos2 expression in muscle fibres. (E) Somitic cells of a two- to three-somite stage wild-type embryo injected with GFP-Cos2 RNA exhibiting cytoplasmic distribution of the fusion protein (n=5/5). (F) Superimposition of the GFP channel depicted in E with that of ToPro-3 fluorescence to highlight the nuclei. (G) Somitic cells of a two- to three-somite stage wild-type embryo injected with GFP-Cos2 RNA and stained with antibodies to ß-tubulin showing the cytoplasmic distribution of microtubules. (H) Superimposition of the image in G with the pattern of GFP-Cos2 distribution reveals substantial overlap of the GFP signal and the microtubules. Panels illustrating embryos in this and subsequent figures are oriented anterior towards the left and dorsal towards the top, unless mentioned otherwise.
Image
Figure Caption
Figure Data
Acknowledgments
This image is the copyrighted work of the attributed author or publisher, and
ZFIN has permission only to display this image to its users.
Additional permissions should be obtained from the applicable author or publisher of the image.
Full text @ Development

