
FIGURE
Fig. 2
- ID
- ZDB-FIG-240731-41
- Publication
- Zhou et al., 2024 - Functions of Epimedin C in a zebrafish model of glucocorticoid-induced osteoporosis
- Other Figures
- All Figure Page
- Back to All Figure Page
Fig. 2
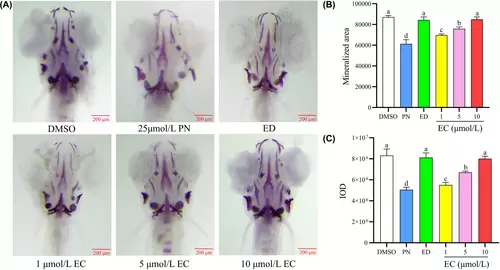
Effect of different concentrations of EC on bone mineralization and bone mass accumulation in the skulls of zebrafish larvae (n = 6). (A) Zebrafish larvae at 9 dpf were treated with different EC concentrations and were stained with alizarin red S. Images show the ventral view of zebrafish skulls. (B) Mineralized area assessed by measuring the areas of the stained skulls. (C) IOD of the stained skulls measured using quantitative analysis. Scale bar: 200 μm. Different letters above the error bars indicate significant differences (p < 0.05) among the groups. |
Expression Data
Expression Detail
Antibody Labeling
Phenotype Data
Phenotype Detail
Acknowledgments
This image is the copyrighted work of the attributed author or publisher, and
ZFIN has permission only to display this image to its users.
Additional permissions should be obtained from the applicable author or publisher of the image.
Full text @ J. Cell. Mol. Med.