
FIGURE
Fig. 3 Supplemental 1
- ID
- ZDB-FIG-240729-39
- Publication
- Weiss et al., 2024 - A syngeneic spontaneous zebrafish model of tp53-deficient, EGFRvIII, and PI3KCAH1047R-driven glioblastoma reveals inhibitory roles for inflammation during tumor initiation and relapse in vivo
- Other Figures
- All Figure Page
- Back to All Figure Page
Fig. 3 Supplemental 1
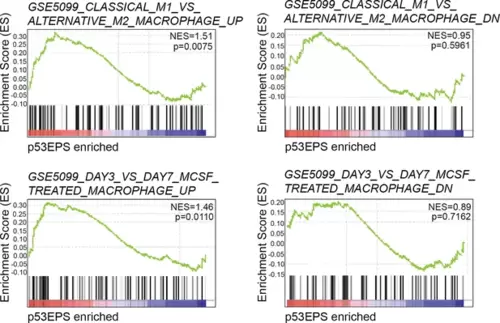
Gene set enrichment analysis (GSEA) plots of established gene signatures for classical M1 polarized macrophages (Classical_M1_VS_Alternative_M2_Macrophage_UP), compared to alternative M2 macrophages (Classical_M1_VS_Alternative_M2_Macrophage_DN). GSEA plots of macrophage-specific gene expression at early (DAY3 UP) and late (DAY3 Down) time points of stimulation with macrophage colony stimulating factor (MCSF). Normalized enrichment scores (NES) and nominal p-values are indicated. |
Expression Data
Expression Detail
Antibody Labeling
Phenotype Data
Phenotype Detail
Acknowledgments
This image is the copyrighted work of the attributed author or publisher, and
ZFIN has permission only to display this image to its users.
Additional permissions should be obtained from the applicable author or publisher of the image.
Full text @ Elife