
Figure 7
- ID
- ZDB-FIG-240613-48
- Publication
- D'Gama et al., 2024 - Ciliogenesis defects after neurulation impact brain development and neuronal activity in larval zebrafish
- Other Figures
- All Figure Page
- Back to All Figure Page
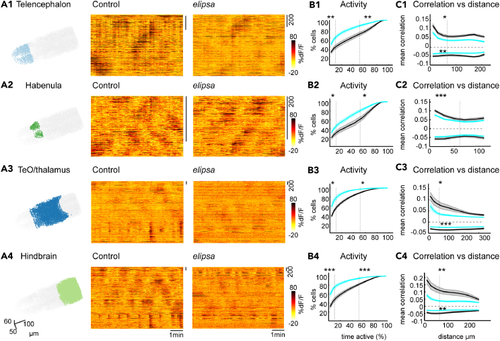
Reduced ongoing spontaneous activity and correlation in the (A1–A4) Three-dimensional representation of segmented neurons and their activity for one representative control and (B1–B4) Average cumulative frequency distribution graphs showing the percentage of activity of neurons in Telencephalon (B1), Habenula (B2), TeO/thalamus (B3) and Hindbrain (B4), for control (black) and (C1–C4) Mean Pearson’s correlation versus distance graphs showing positive and negative correlation between cells in Telencephalon (C1), Habenula (C2), TeO/thalamus (C3) and Hindbrain (C4), for control (black) and mutant (cyan). Significance tests for the correlation were computed for cells located within 60 μm indicated by the dotted line on the X axis. ∗: See also |
| Fish: | |
|---|---|
| Observed In: | |
| Stage: | Day 4 |