|
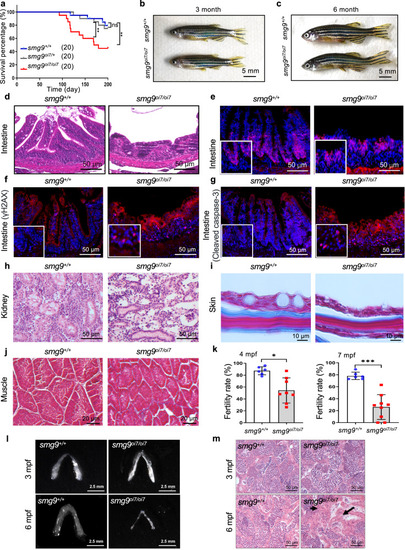
Premature aging phenotype in various tissues in Smg9-deficient zebrafish. a Kaplan–Meier survival curve analysis showing the lifespan of smg9+/+ (n = 20), smg9oi7/+ (n = 20), and smg9oi7/oi7 (n = 20) zebrafish. b, c Representative images of gross appearance of smg9+/+ and smg9oi7/oi7 zebrafish at 3 mpf and 6 mpf. Scale bar: 5 mm. d Representative H&E images of the intestine showing tissue morphology in smg9+/+ and smg9oi7/oi7 zebrafish at 6 mpf. Scale bar: 50 μm. e–g Representative images of immunofluorescence staining for PCNA (e), γH2AX (f), and cleaved caspase-3 (g) in the intestinal segments of smg9+/+ and smg9oi7/oi7 zebrafish at 6 mpf. Scale bar: 50 μm. h Representative H&E images of the kidney tissue morphology in smg9+/+ and smg9oi7/oi7 zebrafish at 6 mpf. Scale bar: 50 μm. i, j Representative images of Masson’s trichrome staining of smg9+/+ and smg9oi7/oi7 skin (i) and muscle (j) at 6 mpf. Scale bar: 10 μm (i). Scale bar: 20 μm (j). k Fertility rate of smg9+/+ and smg9oi7/oi7 zebrafish at 4 mpf and 7 mpf, as determined by mating smg9+/+ or smg9oi7/oi7 male zebrafish with smg9+/+ female zebrafish and counting embryo survival after 12 hpf. l Representative images of the morphological features of testes in smg9+/+ and smg9oi7/oi7 zebrafish at 3 mpf and 6 mpf. Scale bar: 2.5 mm. m Representative image of H&E staining of testes tissue in smg9+/+ and smg9oi7/oi7 at 3 mpf and 6 mpf. Sperm (black arrow) was absent in the 6 mpf smg9oi7/oi7 zebrafish. Scale bar: 50 μm. Error bars indicate SD. *P < 0.05, ** P < 0.01, and *** P < 0.001. ns: not significant.
|