
Fig. 3
- ID
- ZDB-FIG-240530-3
- Publication
- Feng et al., 2024 - Core planar cell polarity genes VANGL1 and VANGL2 in predisposition to congenital vertebral malformations
- Other Figures
- All Figure Page
- Back to All Figure Page
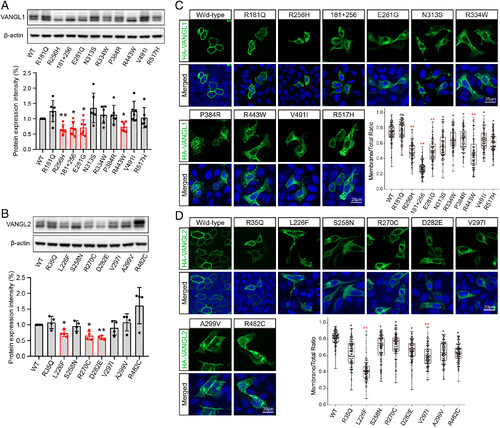
Effects of VANGL1 and VANGL2 variants on expression and localization. (A and B) Protein expression of VANGL1 and VANGL2 mutants in HEK293T cells. Band intensities of western blot gels were quantitated using ImageJ and normalized with β-actin. Each experiment was repeated at least three times. The significance of the differences was calculated by a one-way ANOVA test, F = 8.77 (A), 10.67 (B). Error bars show the mean ± SD. The panels labeled in red show a significant difference, compared with the corresponding wild-type group, *P < 0.05, **P < 0.01. (C and D) Intracellular localization of wild-type and mutant VANGL1 and VANGL2 proteins. The HA-tagged VANGL1/2 proteins were stained in green, and nuclei were visualized by DAPI in blue. Membrane localization ratios of wild-type and mutant VANGL1 and VANGL2 were analyzed by ImageJ in more than 100 cells for each group. The significance of the differences was calculated by a one-way ANOVA test, F = 114.50 (C), 69.72 (D). *P < 0.05, **P < 0.01, and the mean difference between wild-type and labeled groups exceeded 0.2. Box plots show the center line as the median, box limits as the upper and lower quartiles, and whiskers as the minimum to maximum values. |