
Fig. 4
- ID
- ZDB-FIG-240416-9
- Publication
- Lin et al., 2024 - Lipid regulation of protocatechualdehyde and hydroxysafflor yellow A via AMPK/SREBP2/PCSK9/LDLR signaling pathway in hyperlipidemic zebrafish
- Other Figures
- All Figure Page
- Back to All Figure Page
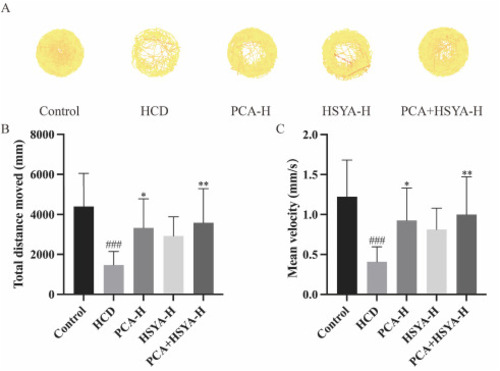
Behavior evaluation of zebrafish larvae in each group. The Control group; HCD group; PCA-H, HCD + PCA 100 μg/mL; HSYA-H, HCD + HSYA 100 μg/mL; PCA + HSYA-H, HCD + PCA 100 μg/mL + HSYA 100 μg/mL (A)Behavioral trajectories of each group of zebrafish larvae. (B)Graphical representation of total distance moved (mm) of treated larvae in the Control, HCD, PCA-H, HSYA-H and PCA + HSYA-H groups. (C)Graphical representation of the mean velocity (mm/s) of treated larvae in the Control, HCD, PCA-H, HSYA-H and PCA + HSYA-H groups. ###P < 0.001, in comparison with the Control group. *P < 0.05, **P < 0.01, in comparison with the HCD group, and the error bars represent SD. |