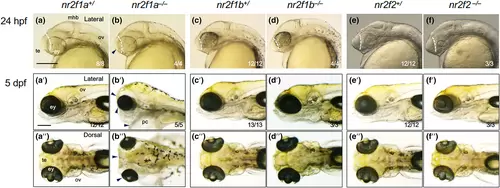
Deformed morphology of the head in nr2f mutants. The heads of embryos obtained by heterozygotic crosses for nr2f1a mutants (a–b″), nr2f1b mutants (c–d″), and nr2f2 mutants (e–f″) are shown at 24 hpf (a–f) and 5 dpf (a′–f″) in lateral views with the anterior side to the left and the dorsal side to the top (a–f′) or dorsal views with the anterior side to the left (a″–f″). Each embryo was genotyped after capturing images. Wild-type embryos and heterozygotes, which were morphologically indistinguishable, are combined and shown on the left (a–a″, c–c″, e–e″), whereas homozygotes (b–b″, d–d″, f–f″) are shown on the right. At the bottom right, the number of embryos with the shown morphology and the total number of embryos with the indicated genotype are shown. The posterior boundaries of the telencephalon are shown with white dashed curves. Arrows indicate the anomalies observed in homozygotes. mhb, midbrain–hindbrain boundary; ov, otic vesicle; pc, pericardial cavity. For the rest of abbreviations, see the legend to Figure 1. Scale bar, 200 μm.
|

