|
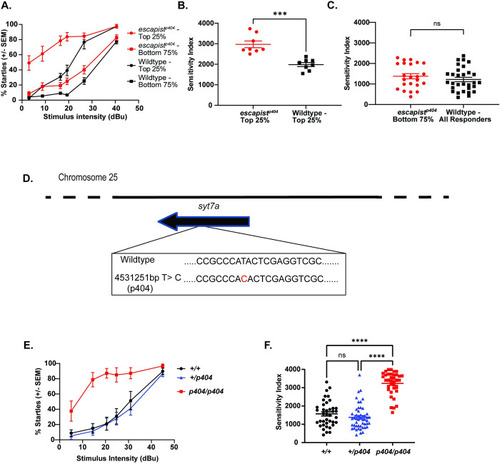
RNA sequencing linkage analysis identifies a single base pair change on Chromosome 25 that is tightly linked to the escapist hypersensitive phenotype. (A) Acoustic sensitivity curve for escapist and wildtype (WIK) 5-day old larval zebrafish. X-axis represents stimulus intensity (dBu) and Y-axis represents percent short latency (SLC) startles. Larvae were placed in the following groups: the top 25% responsive larvae from the escapist line (escapist- Top 25%, n = 8 larvae), the bottom 75% responsive larvae from the escapist line (escapist -Bottom 75%, n = 23 larvae), the top 25% responsive larvae from the wildtype WIK line (Wildtype- Top 25%, n = 8 larvae), the bottom 75% responsive larvae from the wildtype WIK line (Wildtype- Bottom 75%, n = 22 larvae). (B) The area under the sensitivity curve was computed to generate the sensitivity index for each individual larva represented in Fig 1A. Sensitivity index for the top 25% responders from the escapist line (red circles) and wildtype WIK lines (black squares). Unpaired t-test for escapist Top 25% vs wildtype Top 25%: p = 0.0001. (C) Sensitivity index for the bottom 75% escapist responders (red circles) and all responders from the wildtype WIK lines (black squares). Unpaired t-test for escapist Bottom 75% vs wildtype All responders: p = 0.3380 (ns). (D) Schematic of linked region on Chromosome 25 identified through RNA Sequencing linkage analysis using zv9 as a reference genome. Analysis of linked mutations identified one single nucleotide base pair change (chr25:4531251bp T->C or p404) as highly linked to the escapist hypersensitive phenotype. Sequence shown is of the reverse strand. (E) Acoustic sensitivity curve for 5dpf larvae from crosses of escapist carriers genotyped for the p404 lesion. Homozygous wildtype (+/+, n = 39 larvae) curve shown in black, heterozygous (+/p404, n = 50 larvae) shown in blue, homozygous mutant (p404/ p404, n = 36 larvae) shown in red. (F) Sensitivity index for escapist line sensitivity curves shown in 1E using p404 for genotyping. Kruskal-Wallis test performed with Dunn’s test for multiple comparisons. WT vs. Mut: p<0.0001; Het vs Mut: p<0.0001; WT vs Het: p = 0.8723.
|

