FIGURE

Fig. 5

ID
ZDB-FIG-240219-35
Publication
Spratt et al., 2023 - Multivalent insulin receptor activation using insulin-DNA origami nanostructures
Other Figures
All Figure Page
Back to All Figure Page
Fig. 5

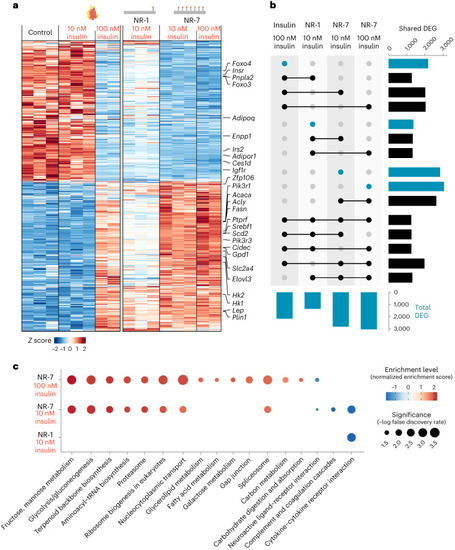
Valency of insulin on NanoRods modulates transcriptional responses.

a, Heat map of DEG (P ≤ 0.001; log2fold change, ±0.58) in adipocyte cultures treated with medium (Control), insulin at 10 or 100 nM, NR-1 at 10 nM of insulin and NR-7 at 10 nM or 100 nM of insulin for 4 h. b, UpSet plot visualizing the total number (blue bars) and shared (black bars) DEG across all the conditions for which DEG were detected. c, GSEA with false-discovery rate adjustment for KEGG pathways enriched (P ≤ 0.05) in cells treated with NR-1 at 10 nM insulin or NR-7 at 10 and 100 nM insulin. The highlighted categories indicate pathways associated with insulin metabolism. INS denotes insulin.

Source data

Expression Data

Expression Detail
Antibody Labeling
Phenotype Data

Phenotype Detail
Acknowledgments
This image is the copyrighted work of the attributed author or publisher, and ZFIN has permission only to display this image to its users. Additional permissions should be obtained from the applicable author or publisher of the image. Full text @ Nat Nanotechnol