
Fig. 4
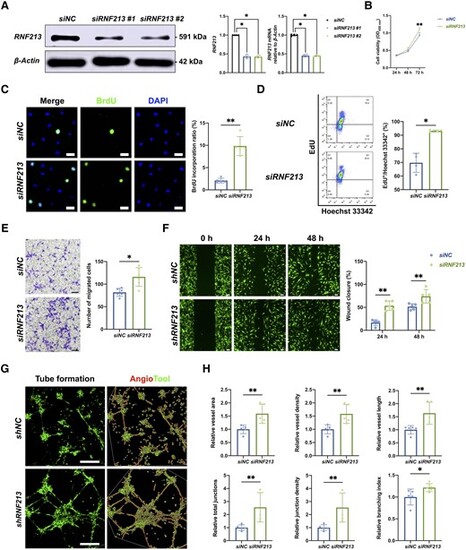
Endothelial RNF213 knockdown promotes HBMEC proliferation, migration and angiogenesis. (A) Two designed siRNA/shRNA sequences were used to mimic RNF213 loss-of-function conditions, which were confirmed by western blot (siNC versus siRNF213 #1: n = 4, 1.00 ± 0.00 versus 0.43 ± 0.05, P = 0.0286; siNC versus siRNF213 #2: n = 4, 1.00 ± 0.00 versus 0.42 ± 0.03, P = 0.0286) and qRT-PCR analyses (siNC versus siRNF213 #1: n = 4, 1.00 ± 0.03 versus 0.45 ± 0.04, P = 0.0286; siNC versus siRNF213 #2: n = 4, 1.00 ± 0.03 versus 0.45 ± 0.02, P = 0.0286). (B) The siRNF213-treated human brain microvascular endothelial cells (HBMECs) showed greater cell viability than the siNC-treated HBMECs at 48 h (n = 6, 0.47 ± 0.03 versus 0.52 ± 0.05, P = 0.0931) and also showed significantly greater cell viability at 72 h (n = 6, 0.93 ± 0.07 versus 1.09 ± 0.06, P = 0.004) based on the results of CCK-8 assays. (C) A BrdU incorporation assay was conducted to measure the proliferation of siNC- and siRNF213-treated HBMECs. The siRNF213-treated HBMECs showed a significantly greater BrdU incorporation ratio than the siNC-treated HBMECs (n = 5, 2.09 ± 0.47 versus 9.84 ± 1.89%, P = 0.0079). Scale bar = 20 µm. (D) Flow cytometry was used to assess the proliferation of siNC- and siRNF213-treated HBMECs after labelling with EdU and Hoechst 33342. The siRNF213-treated HBMECs showed a significantly greater cell proliferation ratio than the siNC-treated HBMECs (n = 4, 69.75 ± 6.07 versus 93.15 ± 0.62%, P = 0.0286). (E) Transwell assays were performed to measure vertical HBMEC migration. siRNF213-treated HBMECs showed greater vertical migration than siNC-treated HBMECs (n = 6, 86.25 ± 38.92 versus 124.75 ± 57.69, P = 0.0152). Scale bar = 100 µm. (F) A wound healing assay was used to measure horizontal HBMEC migration. The siRNF213-treated HBMECs showed markedly greater horizontal migration than the siNC-treated HBMECs at 24 h (n = 5, 16.16 ± 6.44 versus 55.45 ± 9.20, P = 0.0079) and 48 h (n = 5, 49.76 ± 5.26 versus 73.36 ± 14.78, P = 0.0079). Scale bar = 100 µm. (G) A tube formation assay was performed to measure HBMEC angiogenesis. AngioTool software was used to automatically detect the vessel length (red) and junctions (green). Scale bar = 100 µm. (H) The siRNF213-treated HBMECs showed significantly greater vessel area (n = 5, 1.00 ± 0.16 versus 1.59 ± 0.36, P = 0.0079), vessel density (n = 5, 1.00 ± 0.17 versus 1.58 ± 0.36, P = 0.0079), vessel length (n = 5, 1.00 ± 0.16 versus 1.63 ± 0.42, P = 0.0079), total number of junctions (n = 5, 1.00 ± 0.22 versus 2.56 ± 1.13, P = 0.0079), junction density (n = 5, 1.00 ± 0.23 versus 2.54 ± 1.12, P = 0.0079), and branching index values (n = 5, 1.00 ± 0.18 versus 1.22 ± 0.09, P = 0.0317) than the siNC-treated HBMECs. Each dot represents one sample. The means ± SDs are shown. The dashed line indicates the region of interest. *P < 0.05, **P < 0.01, ***P < 0.001 and ****P < 0.0001. |