Fig. 5
- ID
- ZDB-FIG-240205-35
- Publication
- Chen et al., 2023 - Circadian clock1a coordinates neutrophil recruitment via nfe212a/duox-reactive oxygen species pathway in zebrafish
- Other Figures
- All Figure Page
- Back to All Figure Page
|
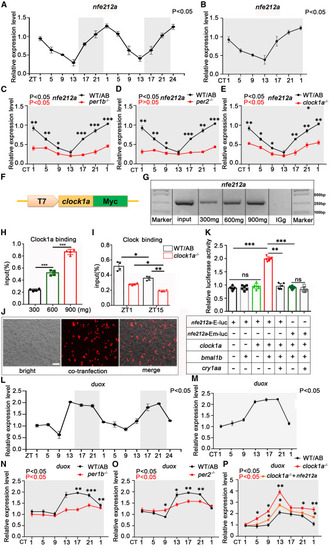
Zebrafish nfe212a and duox genes are rhythmically regulated by Clock1a Zebrafish embryos were raised in LD conditions for 4 consecutive days and then tested in LD and DD conditions at 5 dpf. (A and B) nfe212a was expressed rhythmically in zebrafish larvae under LD and DD conditions. The rhythmic mRNA expression was analyzed by the JTK-CYCLE method. (C–E) Upregulated expression of nfe212a in per1b−/−, per2−/−, and clock1a−/− mutant zebrafish under DD conditions. Each experiment included three samples, and each sample contained 50 larvae. The genes were expressed relative to β-actin. The rhythmic mRNA expression was analyzed by the JTK-CYCLE method. (F) The clock1a-Myc sequence was cloned and inserted into the expression vector with the T7 promoter. (G and H) ChIP-qPCR assays showed that exogenous Clock1a bound to the E-box element in the nfe212a promoter. Data were analyzed with one-way ANOVA. (I) ChIP-qPCR assays showed that endogenous Clock bound to the E-box element in the nfe212a promoter at ZT1 and ZT15. Data were analyzed with one-way ANOVA. (J) The nfe212a-E-luc and CMV-dsRed plasmids were co-transfected into 293T cells. Scale bar: 30 μm. (K) Luciferase reporter assays showed that nfe212a-E-luc was activated by Clock1a and Bmal1b but inhibited by Cry1aa. Data were analyzed with one-way ANOVA. (L and M) Duox was rhythmically expressed in zebrafish larvae under LD and DD conditions. The rhythmic mRNA expression was analyzed by the JTK-CYCLE method. (N–P) The rhythmic expression of nfe212a in per1b−/− and per2−/− mutant zebrafish under DD conditions was significantly disrupted. The clock1a mutant upregulated duox expression, and nfe212a mRNA rescued this phenomenon. The rhythmic mRNA expression was analyzed by the JTK-CYCLE method. All experiments were repeated three times, and the results show the data from an independent experiment. Bar graphs represent the mean ± SEM (∗p < 0.05; ∗∗p < 0.01; ∗∗∗p < 0.001). |

