
Fig. 2
- ID
- ZDB-FIG-240131-9
- Publication
- Araujo-Silva et al., 2023 - Individual differences in response to alcohol and nicotine in zebrafish: gene expression and behavior
- Other Figures
- All Figure Page
- Back to All Figure Page
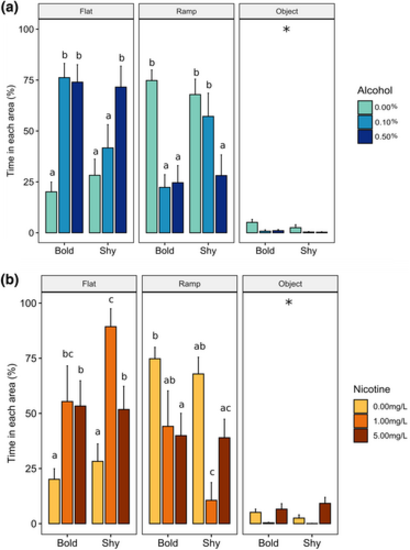
Zebrafish behavior in the exploration tank with ramp after (a) alcohol or (b) nicotine treatment. The experimental tank was divided into three areas: a flat area, a ramp area, and an object area located at the top of the ramp. Fish were acutely treated with alcohol (60 min, n = 10 per group) or nicotine (3 min, n = 10 per group) and then placed in the ramp tank (flat area). Behavior was recorded for 10 min. Results are presented as mean ± SEM. Different letters indicate statistically significant differences between treatments in each area (bold and shy groups: three-way ANOVA, p < .05). Asterisks indicate statistically significant differences between areas (p < .05) |