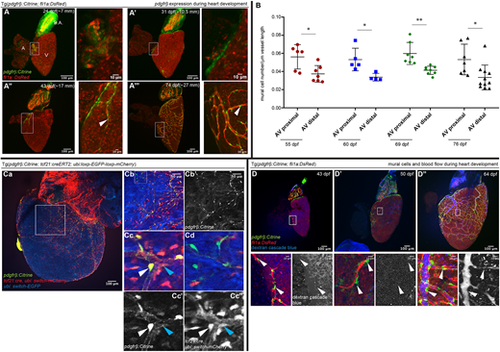
pdgfrb expression and mural cell origin in the developing zebrafish heart. (A-A‴) pdgfrb expression during heart development at 24 dpf (∼7 mm in body length; A), 31 dpf (∼10.5 mm in body length; A′), 43 dpf (∼17 mm in body length; A″) and 74 dpf (∼27 mm in body length; A‴). The boxed areas are enlarged in the images to the right. Green, pdgfrb:mCitrine; red, coronary endothelial cells marked by Tg(fli1a: DsRed). A, atrium; B.A. bulbus arteriosus; V, ventricle. n=5 hearts for each time point. (B) Quantification of pdgfrb+ mural cell association. Mural cell number per µm of the coronary vessels proximal or distal to the AVC at different time points (55, 60, 69 and 76) dpf. Boxes in A indicate the vessels quantified as proximal to AVC. n=5-7 hearts for each time point. Error bars represent s.d. *P≤0.05, **P≤0.01 (unpaired, two-tailed t-test). (C-C‴) tcf21+ lineage traced cells contribute to pdgfrb+ mural cells. (Ca) Representative image of a tcf21 lineage-traced fish at 87 dpf. ubi:switch-GFP (artificially colored blue) switches to ubi:switch-mCherry after recombination. pdgfrb:Citrine, green. (Cb-Cc) Enlarged views of the boxed areas in Ca and Cb. (Cc) tcf21 lineage-traced (mCherry) cells co-labeled with pdgfrb+ cells (white arrowhead) and pdgfrb− non-mural cell (blue arrowhead). Cc′ and Cc″ show single channels. (Cd) pdgfrb+ cells (green) that are negative for the tcf21 lineage. n=3. (D-D″) Mural cell association around the coronary vessels does not depend on blood flow. Coronary angiography (dextran, blue) was performed to monitor blood flow at 43 (D), 50 (D′) and 64 (D″) dpf. White arrowheads indicate pdgfrb+ mural cells in the images (enlarged views of the boxed areas above). n=5-6 hearts for each time point.
|

