
Fig. 3
- ID
- ZDB-FIG-231213-32
- Publication
- Wasilewska et al., 2023 - Lack of Stim2 Affects Vision-Dependent Behavior and Sensitivity to Hypoxia
- Other Figures
- All Figure Page
- Back to All Figure Page
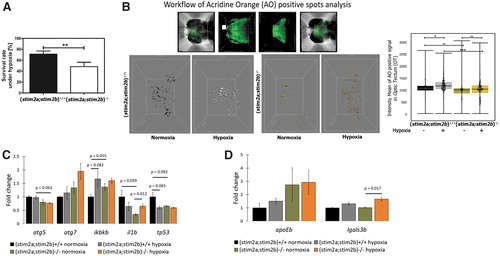
Effect of hypoxia on survival, cell death, and gene expression in (stim2a;stim2b)+/+ and (stim2a;stim2b)−/− larvae. (A) The survival rate is expressed as the mean ± SEM of n ≥ 180 larvae per group. (B) On the left upper panel, there are representative images of AO staining and the lower panel presents AO-positive cells in the OT in (stim2a;stim2b)+/+ and (stim2a;stim2b)−/− larvae. The right panel shows its quantification, n = 18 larvae per group. (C) Expression of selected genes that are related to cell death pathways and (D) microglia-associated genes, estimated by qPCR, in (stim2a;stim2b)+/+ and (stim2a;stim2b)−/− larvae. The data are expressed as the mean ± SEM of n = 3–6 samples/group. *p < 0.05, **p < 0.01, ***p < 0.001. AO, Acridine Orange; OT, optic tectum; qPCR, quantitative polymerase chain reaction. |