
Fig. 1
- ID
- ZDB-FIG-231128-22
- Publication
- Pownall et al., 2023 - Chromatin expansion microscopy reveals nanoscale organization of transcription and chromatin
- Other Figures
- All Figure Page
- Back to All Figure Page
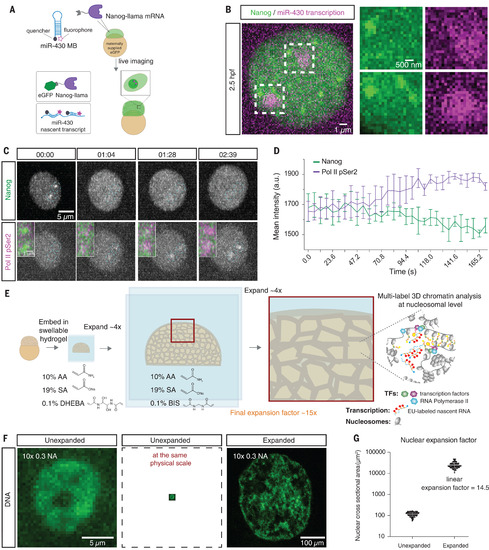
Nanog forms DNA-bound foci associated with zygotic transcription. (A) Schematic that details how Nanog and miR-430 transcription were visualized in living embryos. eGFP, enhanced green fluorescent protein. (B) Live imaging shows Nanog foci associated with miR-430 transcription at 2.5 hpf. n = 10 nuclei. (C) Live imaging shows Nanog foci are formed and disappear before Pol II elongation at = 2.75 hpf. n = 2 nuclei, 1 embryo. (D) Quantification of fluorescence intensity in (C). a.u., arbitrary unit. (E) Schematic that shows the process of ChromExM and expected results. AA, acrylamide; BIS, N,N′-methylenebis(acrylamide); DHEBA, N,N′-(1,2-dihydroxyethylene)bisacrylamide; EU, 5-ethynyl uridine; SA, sodium acrylate. (F) Unexpanded and expanded nuclei from two unrelated embryos stained for DNA and imaged with a 10× 0.3 numerical aperture (NA) objective demonstrate the enhanced resolution provided by ChromExM. Scale bar is not corrected for the expansion factor. (G) Quantification of the nuclear expansion factor determined by measuring the nuclear cross-sectional area. n = 171 unexpanded nuclei from 3 embryos and 104 expanded nuclei from 17 embryos. |