
Fig. 3
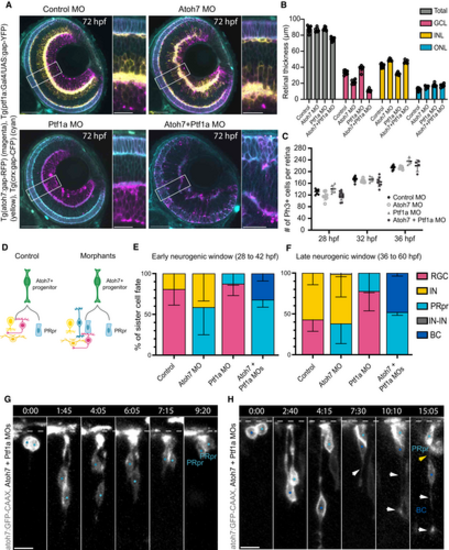
Probabilistic lineage branch shows flexibility upon interference with fate probabilities Retina at 72 hpf in (top left) control, (top right) Atoh7 knockdown, (bottom left) Ptf1a knockdown and (bottom right) Atoh7 and Ptf1a knockdown. Atoh7+ cells (magenta), inhibitory neurons (yellow) and photoreceptors (cyan). Scale bar 50 μm, 20 μm in close-up panels. Layer thickness analysis in control and morphant embryos measured at 72 hpf. N = 9 embryos (control), 7 embryos (Atoh7 morphant), 7 embryos (Ptf1a morphant) and 7 embryos (Atoh7 + Ptf1a morphant). P-values for thickness measurements are found in Table 3. Mixed-effects analysis with Bonferroni correction. Mean and SD are indicated, as well as single values. Number of PH3+ cells per retina in control and morphant conditions at 28, 32 and 36 hpf. N = 4 to 10 embryos per condition, mixed-effects analysis with Dunnett's correction. All comparisons are statistically non-significant. Mean and SD are indicated, as well as single values. Schematic comparison of the outcome of Atoh7+ progenitor divisions in control and morphants. Proportions of PRpr sister cell fates during early neurogenesis. Mean and 95% CI are indicated. For Atoh7 morphants, n = 48 divisions and N = 4 embryos. For Ptf1a morphants, n = 39 divisions and N = 4 embryos. For Atoh7 + Ptf1a morphants, n = 62 divisions and N = 4 embryos. Proportions of PRpr sister cell fates during late neurogenesis. Mean and 95% CI are indicated. For Atoh7 morphants, n = 47 divisions and N = 4 embryos. For Ptf1a morphants, n = 41 divisions and N = 5 embryos. For Atoh7 + Ptf1a morphants, n = 50 divisions and N = 4 embryos. Montage of neurogenic progenitor division upon Atoh7 and Ptf1a knockdown, generating two PRprs (cyan dots). Dashed line indicates the apical side. atoh7:GFP-CAAX (Atoh7, grey). Scale bar 10 μm. Montage of neurogenic progenitor division upon Atoh7 and Ptf1a knockdown, generating a BC (blue dot) and a PRpr (cyan dot). Dashed line labels the apical side, yellow arrow points at BC apical process and white arrows point at BC basal process. atoh7:GFP-CAAX (Atoh7, grey). Scale bar 10 μm. |