FIGURE

Figure 2

ID
ZDB-FIG-231030-84
Publication
Xi et al., 2023 - Study on Carbohydrate Metabolism in Adult Zebrafish (Danio rerio)
Other Figures
All Figure Page
Back to All Figure Page
Figure 2

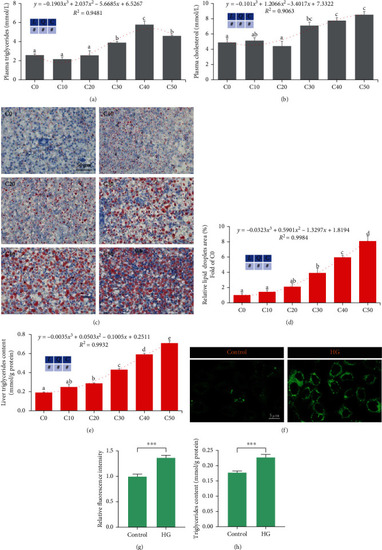
Excess carbohydrates elevated lipid accumulation in zebrafish and ZFL (means ± SEM, n = 6). C0, C10, C20, C30, C40, and C50 represent diets in which dextrin levels are 0%, 10%, 20%, 30%, 40%, and 50%, respectively. L represents a linear trend, Q represents a quadratic trend, C represents a cubic trend, and # represents the significant of the corresponding regressions. HG represents high glucose. (a) Plasma triglycerides, (b) plasma cholesterol, (c) representative images of the liver oil red O staining, scale bar, 50 μm, (d) relative areas of lipid droplets in oil red O staining, (e) triglycerides in the liver of zebrafish, (f) representative images of BODIPY staining in ZFL, scale bar, 5 μm, (g) lipid content was quantified by mean green fluorescence intensity by BODIPY 493/503 staining, and (h) triglycerides content in ZFL. Labeled means without a common letter differ among C0, C10, C20, C30, C40, and C50, P < 0.05 (one-way ANOVA, Duncan's post hoc test).  P < 0.005 (two-tailed independent t-test).

Expression Data

Expression Detail
Antibody Labeling
Phenotype Data

Phenotype Detail
Acknowledgments
This image is the copyrighted work of the attributed author or publisher, and ZFIN has permission only to display this image to its users. Additional permissions should be obtained from the applicable author or publisher of the image. Full text @ Aquac Nutr