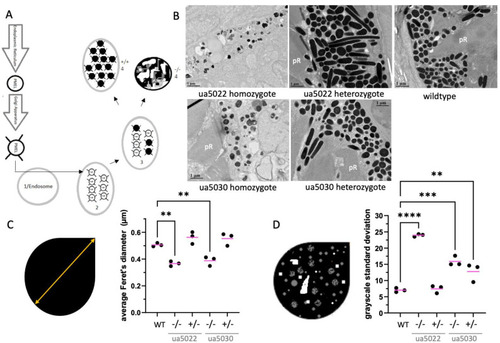
The repeat region of the Pmela protein is required for the elongation of melanosomes and the even distribution of melanin within melanosomes. (A) Schematic of the maturation of premelanosome protein (Pmel) and the melanosome. Pmel is made in the endoplasmic reticulum and modified in the Golgi apparatus before entering an endosome. The endosome then goes through four stages (1 → 4) of maturation before becoming a fully formed (WT) melanosome. Stage 1: fibril-free endosome; Stage 2: fibrils begin forming; Stage 3: melanin starts to be deposited on the fibrils; Stage 4: melanin is evenly distributed, obscuring the fibrils. Melanosomes are oblong in shape (WT). In Pmel-knockout mice (−/−), the mature melanosome has irregularly distributed melanin and is round like in Stage 1 [18]. (B) Sample transmission electron microscopy images of retinas from 5-day post-fertilization zebrafish of various pmela genotypes: wildtype, ua5022 homozygous and heterozygous, and ua5030 homozygous and heterozygous. pR = photoreceptor. (C) A pictograph of measuring Feret’s diameter (orange arrow—the longest distance that could be measured in a straight line within the confines of the melanosome) accompanies the results from the different genotypes; the ANOVA with Tukey’s post hoc test shows the average Feret’s diameter of melanosomes is shorter in the two homozygote mutants, ua5022 and ua5030, when compared to that of the wildtype. (D) Melanin deposition is uneven in several pmela genotypes. The average grayscale value is measured by pixels within single melanosomes, and the grayscale standard deviation is calculated on individual melanosomes. This standard deviation is used as a metric for general variation within all the melanosomes of an individual. Wildtype melanosomes are homogenous with low standard deviation; in contrast, mutants have variable electron density due to unequal distribution (clumping) within the melanosomes. An ANOVA with Tukey’s post hoc test shows the melanin deposition in melanosomes (average grayscale standard deviation) is more variable in ua5022 homozygotes, and in both ua5030 homozygotes and heterozygotes. ** p < 0.01, *** p < 0.001; **** p < 0.0001. See Supplemental Figure S5 for individual melanosome data.
|
