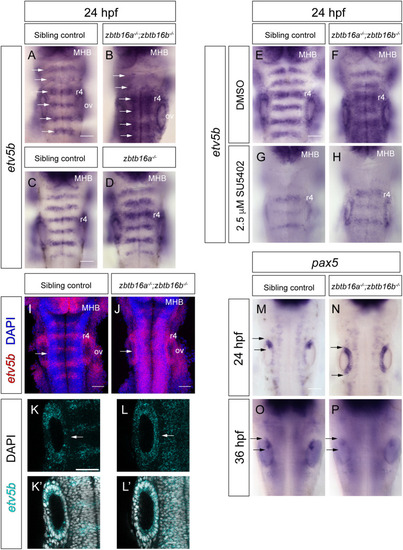
Spatial analysis of Fgf signalling in Zbtb16 mutants. (A,B) Colorimetric ISH for etv5b in sibling control (A; n=59) and zbtb16a−/−;zbtb16b−/− (B; n=25) embryos. Dorsal views of the hindbrain, wholemount. Arrows indicate rhombomere centres. (C,D) ISH for etv5b in sibling control (C; n=18) and zbtb16a−/− (D; n=6) embryos. (E,F) Sibling control (E; n=88) and zbtb16a−/−;zbtb16b−/− (F; n=28) embryos treated with DMSO from 22 to 24 hpf and stained for etv5b. (G,H) Sibling control (G; n=73) and zbtb16a−/−;zbtb16b−/− (H; n=38) embryos treated with 2.5 µM SU5402 from 22 to 24 hpf and stained for etv5b. Three independent experiments. (I-L′) HCR for etv5b in 24 hpf; sibling control (n=14) and zbtb16a−/−;zbtb16b−/− (n=9) mutant embryos. 3D reconstructions of the z-stack, dorsal view (I,J); confocal z-stack slices (K-L). Arrows in I-L′ indicate the medial wall of the otic vesicle. (M,N) Colorimetric ISH for pax5 in 24 hpf sibling control (n=10) and zbtb16a−/−;zbtb16b−/− (n=11) embryos. (O,P) ISH for pax5 in 36 hpf sibling control (n=29) and zbtb16a−/−;zbtb16b−/− (n=11) embryos. Arrows in M-P show the antero-posterior extent of marker gene expression in the otic vesicle. MHB, midbrain-hindbrain boundary; ov, otic vesicle; r, rhombomere. Scale bars: 50 µm.
|