|
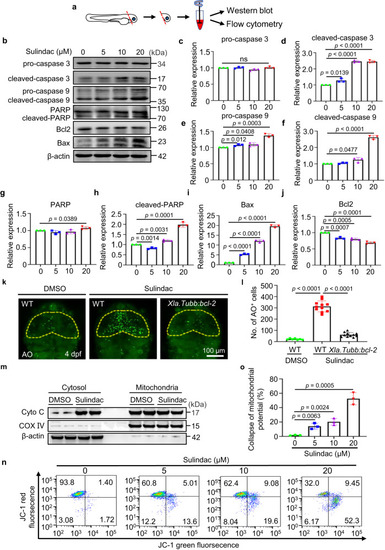
Sulindac induces apoptosis via the mitochondrial pathway. a Schematic diagram showing that the head tissue of embryos was split for Western blotting and flow cytometry. b Western blot analysis of the protein levels of apoptosis-related proteins with sulindac treatment at increasing concentrations. The immunoblot intensity was determined by ImageJ analysis software. c–j The data are presented as the means ± SDs (n = 3 independent biological replicates). NS, not significant. Statistics calculated by unpaired two-tailed Student’s t test. Source data are provided as a Source Data file. β-Actin was used as an internal control. k After treatment with sulindac or DMSO, the number of apoptotic neurons (AO + ) decreased significantly after overexpression of bcl2 in the midbrains of Tg(Xla.Tubb:bcl-2) embryos. l Quantification of AO+ cells in the midbrain. n = 7, 11 and 11 for the DMSO (WT) group, sulindac (WT) group, and sulindac (Xla.Tubb:bcl-2) group, respectively. Each dot in (l) denotes one larva. The values represent the means ± SDs. Statistics calculated by unpaired two-tailed Student’s t test. Source data are provided as a Source Data file. m Western blot analysis of the protein levels of cytochrome c in the cytosolic and mitochondrial fractions of zebrafish larval neurons. The experiment was repeated three times independently with similar results. n Flow cytometric analysis of mitochondrial transmembrane potential (ΔΨm) after staining with JC-1. Zebrafish neuronal cells were treated with increasing concentrations of sulindac. o Quantitative data of sulindac-induced collapse of mitochondrial potential. Each column represents the mean ± SDs (n = 3 independent biological replicates). Statistics calculated by unpaired two-tailed Student’s t test. Source data are provided as a Source Data file.
|