
FIGURE
FIGURE 2
- ID
- ZDB-FIG-230814-234
- Publication
- McClure et al., 2023 - 3' RNA-seq is superior to standard RNA-seq in cases of sparse data but inferior at identifying toxicity pathways in a model organism
- Other Figures
- All Figure Page
- Back to All Figure Page
FIGURE 2
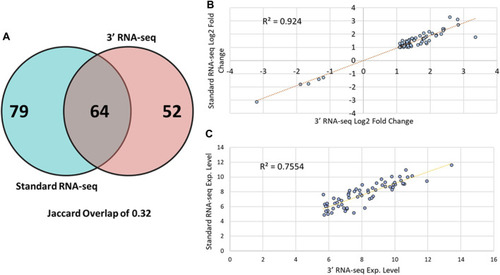
DEG overlap among 3′ and standard RNA-seq. |
Expression Data
Expression Detail
Antibody Labeling
Phenotype Data
Phenotype Detail
Acknowledgments
This image is the copyrighted work of the attributed author or publisher, and
ZFIN has permission only to display this image to its users.
Additional permissions should be obtained from the applicable author or publisher of the image.
Full text @ Front Bioinform