
Fig. 4
- ID
- ZDB-FIG-230723-26
- Publication
- Shainer et al., 2023 - A single-cell resolution gene expression atlas of the larval zebrafish brain
- Other Figures
- All Figure Page
- Back to All Figure Page
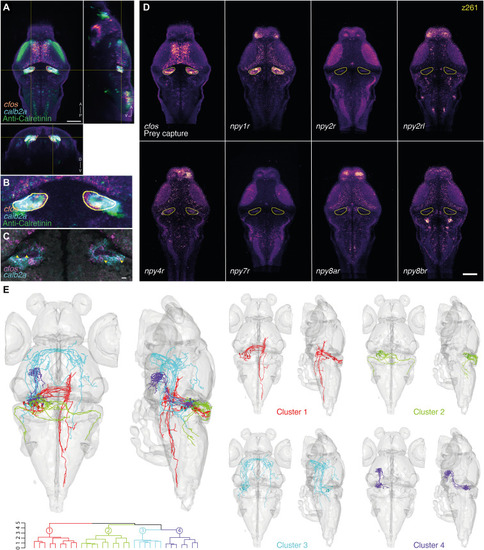
Marker gene expression and hypothetical connectivity of SGN neurons involved in prey capture.
(A) Orthogonal views of the cfos prey capture brain activity map with the registered calb2a FISH and anti-Calretinin immunostaining. An ROI is drawn around the cfos-positive SGN area (yellow). Scale bar, 100 μm. A, anterior; D, dorsal; P, posterior; V, ventral. (B) Enlargement of the cfos-positive SGN area. Possible colabeling was identified between the registered cfos and calb2a data. (C) Multiplexed FISH of calb2a and cfos verified the suggested colabeling (arrowheads). A single focal plane of an individual larva is shown. Scale bar, 10 μm. (D) Expression patterns of several NPY receptors in the same single z plane (z261). The yellow line labels the cfos + SGN area. npy1r shows strong expression within the SGN, which is not seen for the other tested NPY receptors. Scale bar, 100 μm. (E) The ROI drawn in (A) was used to search for single neurons whose somas are within the ROI. Thirty-two neurons were identified, mirrored onto the left hemisphere [see (20)] and hierarchically clustered according to their morphology. One cluster of Purkinje cells (cluster 2) projecting to the octavolateralis nucleus was identified, as well as three clusters of SGN neurons, with projections to the contralateral hindbrain (cluster 1), to the contralateral retinal AF7 and tectum through the postoptic commissure (cluster 3), and to the hypothalamus (cluster 4). |