FIGURE

Fig. 3

ID
ZDB-FIG-230707-23
Publication
Medina-Gomez et al., 2023 - Bone mineral density loci specific to the skull portray potential pleiotropic effects on craniosynostosis
Other Figures
All Figure Page
Back to All Figure Page
Fig. 3

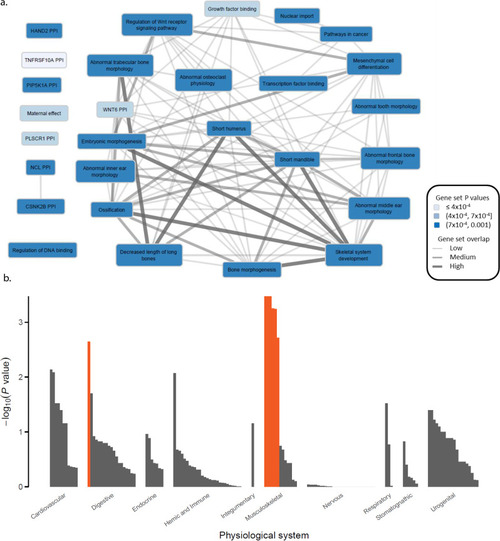
DEPICT results for gene-set and cell/tissue enrichment analyses.

a Meta gene-sets were defined from similarity clustering of significantly enriched gene sets (FDR < 5%). Each Meta gene-set was named after one of its member gene-sets. The color of the Meta gene-sets represents the P value of the member set. Interconnection line width represents the Pearson correlation ρ between the gene membership scores for each Meta gene-set (ρ < 0.3, no line; 0.3 ≤ρ < 0.45, narrow width; 0.45 ≤ρ < 0.65, medium width; ρ ≥ 0.65, thick width). b Bars represent the level of evidence for genes in the associated loci to be expressed in any of the 209 Medical Subject Heading (MeSH) tissue and cell type annotations. Highlighted in orange are these cell/tissue types significantly (FDR < 5%) enriched for the expression of the genes in the associated loci.

Expression Data

Expression Detail
Antibody Labeling
Phenotype Data

Phenotype Detail
Acknowledgments
This image is the copyrighted work of the attributed author or publisher, and ZFIN has permission only to display this image to its users. Additional permissions should be obtained from the applicable author or publisher of the image. Full text @ Commun Biol