
Fig. 1
- ID
- ZDB-FIG-230705-4
- Publication
- Leesch et al., 2023 - A molecular network of conserved factors keeps ribosomes dormant in the egg
- Other Figures
- All Figure Page
- Back to All Figure Page
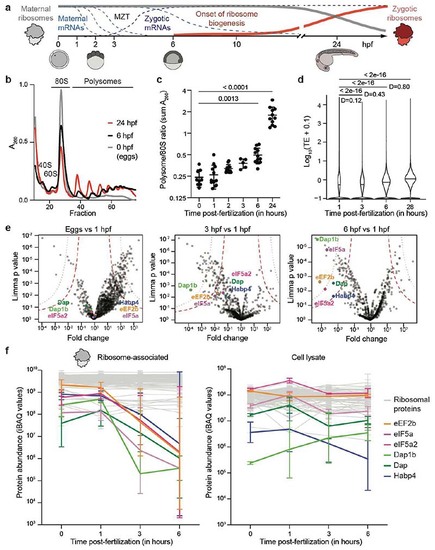
Translation increase during zebrafish embryogenesis anti-correlates with the presence of ribosome-bound factors.
a, Schematic of the maternal-to-zygotic transition (MZT). Clearance of maternal mRNAs is coordinated with the activation of transcription during the first hours post-fertilization (hpf). In zebrafish, replacement of maternal by zygotic ribosomes takes several days. b, Representative zebrafish polysome profiles. A260, absorbance at 260 nm. c, Quantification of polysome-to-monosome ratios (0 hpf: n = 9; 1 hpf: n = 13; 2 hpf: n = 13, 3 hpf: n = 5; 6 hpf: n = 12; 24 hpf: n = 11). Significance was determined with Kruskal-Wallis and Dunn’s two-sided test. Data are mean ± standard deviation (SD). d, Violin plots showing the distribution of the median translation efficiency (TE) during embryogenesis. Significance was assessed by the two-sided Wilcoxon pairwise test and effect size was estimated by Cohen’s D58 (< 0.2: “negligible”; [0.2-0.5]: “small”; [0.5-0.8]: “medium”; > 0.8: “large”). e, Volcano plots based on mass spectrometry data showing fold enrichments of proteins in the ribosome fraction of 1 hpf embryos compared to eggs (left), 3 hpf (middle) and 6 hpf (right) embryos (n = 3 for each time-point). All significantly enriched or depleted proteins are listed in Supplementary Table 1. Permutation-based false discovery rates (FDRs) are displayed as dotted (FDR < 0.01) and dashed (FDR < 0.05) lines. f, Abundance changes of a subset of factors relative to ribosomal proteins in the ribosome-associated proteome (left) and cell lysate (right) (n = 3). Abundances are reported as iBAQ values. 74 ribosomal proteins are plotted in grey. Error bars correspond to geometric SD. For c, e and f, n are biologically independent samples. |