
FIGURE
Figure 4
Figure 4
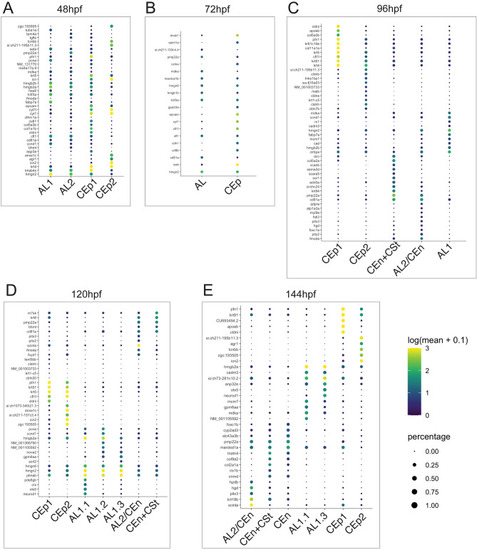
Top 10 genes for AS related cell types at each timepoint examined. (A) Top10 genes from AL1, AL2, CEp1 and CEp2 at 48 hpf. (B) Top10 genes from AL and CEp clusters at 72 hpf. (C) Top10 genes from AL1, AL1/CEn + Cst, AL2/CEn, CEp1 and CEp2 clusters at 96 hpf. (D) Top10 genes from AL1.1, AL1.2, AL1.3, AL1/CEn + CSt, AL2/CEn, CEp1 and CEp2 at 120 hpf. (E) Top10 genes from AL1.2, AL1.3, AL1/CEn + CSt, AL2/CEn, CEn, CEp1 and CEp2 at 144 hpf. Scale of degree of expression and percentage is indicated. |
Expression Data
Expression Detail
Antibody Labeling
Phenotype Data
Phenotype Detail
Acknowledgments
This image is the copyrighted work of the attributed author or publisher, and
ZFIN has permission only to display this image to its users.
Additional permissions should be obtained from the applicable author or publisher of the image.
Full text @ Sci. Rep.