
Figure 4
- ID
- ZDB-FIG-230401-49
- Publication
- Rude et al., 2023 - Coupling Environmental Whole Mixture Toxicity Screening with Unbiased RNA-Seq Reveals Site-Specific Biological Responses in Zebrafish
- Other Figures
- All Figure Page
- Back to All Figure Page
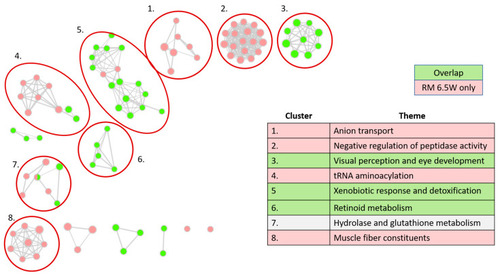
Gene Ontology (GO) network analysis. Each node is a significant GO term from one of three GO: Biological Processes (GO:BP), Cellular Components (GO:CC), or Molecular Functions (GO:MF). Ontologies were truncated to GO terms containing between 15 and 450 genes before computing significant adjuster enrichments on g.profiler2. Edges indicate the proportion of shared genes between terms, with an overlap coefficient (Coverlap = nintersect/ngenes in smaller term) of at least 0.4. Node color indicates gene sets. Gene sets included DEGs meeting │log2FC│ > 0.5 and padj > 0.05, from one of three categories: DEGs specific to RM7 W, DEGs shared between the two treatments, and DEGs specific to RM 6.5W. There were no significant GO terms enriched in the gene set specific to RM 7W. The table indicates the manually determined themes for each cluster. |
| Fish: | |
|---|---|
| Conditions: | |
| Observed In: | |
| Stage Range: | Shield to Long-pec |