Fig. 5
- ID
- ZDB-FIG-230331-5
- Publication
- Ha et al., 2022 - Intermediate cells of in vitro cellular reprogramming and in vivo tissue regeneration require desmoplakin
- Other Figures
- All Figure Page
- Back to All Figure Page
|
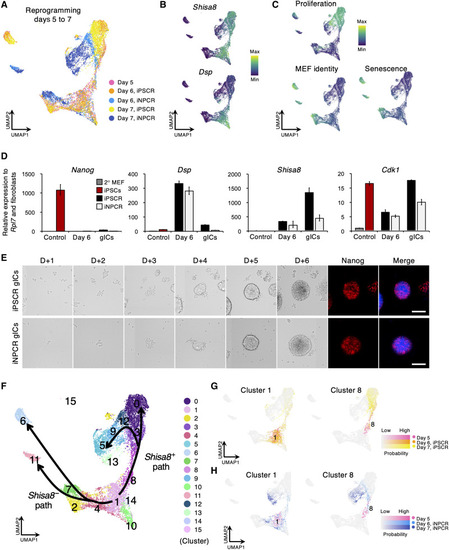
gICs are derived from dICs.
(A) UMAP plots of scRNA-seq data showing cells between days 5 and 7 of iPSCR and iNPCR. (B and C) Signature score distribution for indicated genes (B) and identity gene sets (C) defining dICs and gICs on the UMAP. Scale bars represent the minimum (Min) and maximum (Max) signature scores during the whole reprogramming process. (D) Reverse-transcription quantitative PCR for indicated genes. 2° MEFs were used as a negative control (gray) and iPSCs were used as a positive control for the pluripotency marker (red). Day 6 samples included whole cells of day 6 and gICs were isolated on day 6 of iPSCR (black) and iNPCR (white). (E) Phase-contrast and immunostaining images of the same region of interest after re-attachment of gICs from day 6 of iPSCR or iNPCR (D0). Immunostaining was performed for Nanog on day 6 after reattachment (D+6). Scale bars, 100 μm. (F) Predicted reprogramming trajectories inferred by Slingshot showing the dICs branching to Shisa8-positive and Shisa8-negative paths. Cells are colored by clusters. Error bars represent ± SE. Data are representative of experimental triplicates. (G and H) UMAP plots of cells between days 5 and 7, highlighting the descendants of clusters 1 and 8 during iPSCR (E) and iNPCR (F). Color and intensity represent collection time point and descendant probability estimated by WOT. |

