
Fig. 3
- ID
- ZDB-FIG-230328-34
- Publication
- Ellis et al., 2022 - A missense mutation in the proprotein convertase gene furinb causes hepatic cystogenesis during liver development in zebrafish
- Other Figures
- All Figure Page
- Back to All Figure Page
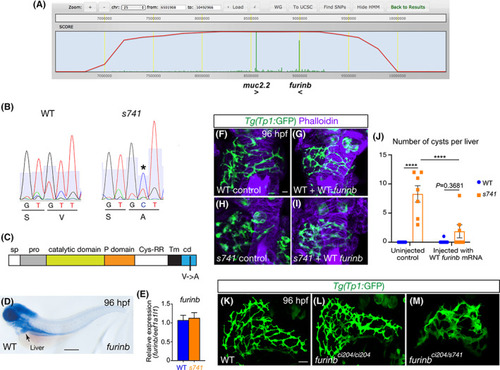
A missense mutation in the furinb gene is responsible for the cystic phenotype in s741 mutants. (A) Genome view of linkage analysis using SNPtrack. Log likelihood analysis (red line) returned an approximate 1.4‐Mb interval on linkage group 25 for the presumptive mutation. The homozygosity score (green) suggested two candidate mutations in the muc2.2 and furinb genes. (B) Sequencing of complementary DNA from s741 mutants and WT siblings. Mutants bear a T‐to‐C mutation (indicated by *) near the C terminus, leading to a V‐to‐A amino acid change. (C) Domain diagram of Furinb protein. The V‐to‐A change occurs within the cytoplasmic domain (cd). (D) Whole‐mount in situ hybridization detecting furinb transcript in WT at 96 hpf. Lateral view; anterior is on the left. (E) Quantitative polymerase chain reaction (PCR) analysis comparing furinb transcripts in the WT and s741 mutant larval livers at 96 hpf. Triplicates were performed. The results are represented as relative expression levels normalized to the housekeeping gene eef1a1l1 (mean ± SEM). Statistical significance was calculated by two‐tailed Student's t test: p = 0.7877. (F–I) Confocal 3D projections showing uninjected control WT and s741 mutant larvae (F,H) and larvae injected with WT furinb messenger RNA (mRNA) (G,I). Phalloidin (purple) stained for F‐actin and Tg(Tp1:GFP) expression (green) labeled the intrahepatic biliary cells. (J) Numbers of cysts per liver (mean ± SEM) in control and WT furinb mRNA‐injected larvae. Each dot represents an individual liver. Statistical significance was calculated by one‐way analysis of variance (ANOVA) and Tukey's post‐hoc test: ****p < 0.0001. (K–M) Confocal 3D projections showing the intrahepatic bile ducts marked by Tg(Tp1:GFP) expression. At least five fish per genotype were examined and all showed the same phenotypes. (F–I,K–M) Ventral views; anterior is to the top. Scale bars: 70 μm (D) and 20 μm (F–I,K–M). Cys‐RR, cysteine‐rich region; pro, pro‐domain; Sp, signal peptide; Tm, transmembrane domain. |