
Fig. 2.
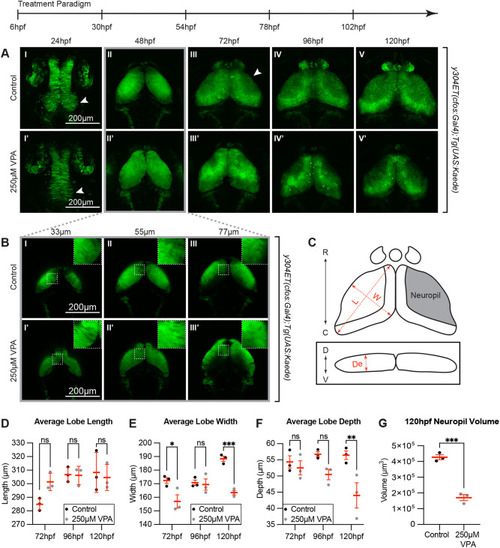
Continuous VPA treatment causes delayed OT development and decreased neuropil. (A) Daily images of control (I-V) and 250 µM VPA-treated y304Et(cfos:Gal4); Tg(UAS:Kaede) embryos (I′-V′). Treated embryos were continuously exposed to VPA from 6-120 hpf. At 24 hpf, proliferation in the neuroepithelium giving rise to the OT is seen in control (arrow, I) but not in treated embryos (arrow, I′). Beginning at 72 hpf, the OT neuropil, where the neurites extend, becomes noticeable in control (arrow, III) but not in treated larvae (III′). (B) Images of single slices of dorsal (33 µm) to ventral (77 µm) positions at 48 hpf in OT of control (I-III) and VPA-treated embryos (I′-III′). Neurogenesis in treated embryos appears delayed as shown by the presence of columnar neuroepithelial cells dorsally in treated embryos (I′, inset in I′) but not in control embryos where neuroprogenitors and early-born neurons (rounded cells) have taken their place (I, inset in I, and Fig. 3; insets are zoomed in areas from the dashed-line ROIs). (C) Cartoon of OT lobe measurements of length, width, and depth. (D) The lobe length of treated larvae is not significantly different than controls. R: rostral, C: caudal, D: dorsal, V: ventral, L: length, W: width, De: depth. (E) Lobe width of treated embryos is significantly decreased at 72 hpf and 120 hpf, while depth is significantly decreased at 120 hpf (F). (G) Neuropil volume is decreased in VPA-treated larvae at 120 hpf. Although these observations were seen in three different week-long experiments (three embryos per experiment and experimental condition), the quantification was done in three embryos from the same experimental week. Different embryos/larvae were imaged each day and euthanized at the end of the imaging session. Data are shown as mean±s.e.m. A two-way ANOVA with Šidák's multiple comparisons test was performed in D-F, and a two-tailed unpaired t-test was performed in G. At 48 hpf, length, width, and depth are difficult to measure since during this time neuroepithelium is transitioning into neuroblasts. *P<0.05; **P<0.01, ***P< 0.001. |