|
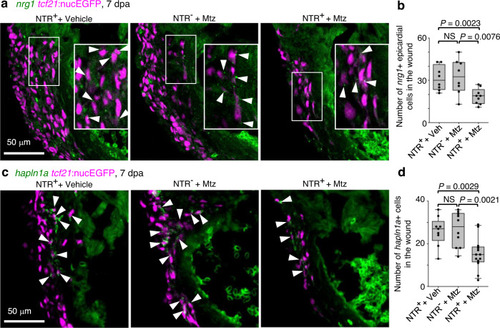
a Section images of the injury site showing HCR staining of nrg1 in green and tcf21:nucEGFP in magenta. The framed regions are enlarged to show details with arrowheads denoting representative nrg1+EGFP+ cells. Scale bar, 50 μm. b Quantification of nrg1+ epicardial cells in the wound regions shown in a. From left to right, n = 8, 8, and 9, respectively. NS, not significant. Two-tailed Student’s t test. c Section images of the injury site showing HCR staining of hapln1a in green and tcf21:nucEGFP in magenta. Arrowheads indicate representative hapln1a+EGFP+ cells. Scale bar, 50 μm. d Quantification of hapln1a+EGFP+ cells in the wound regions shown in c. From left to right, n = 9, 10, and 13, respectively. NS, not significant. Two-tailed Student’s t test. Box plots show the median (center line), upper and lower quartiles (box limits), minimum and maximum values (whiskers), and individual values (points). Source data are provided as a Source data file.
|