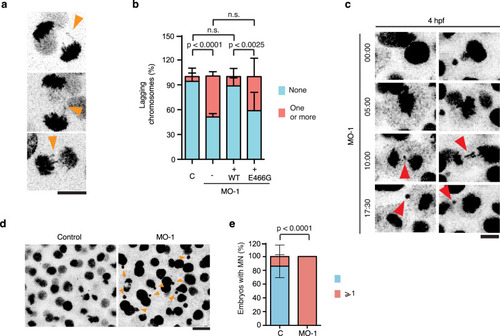
a Selected images from movies of developing zfTTLL11-MO embryos showing several chromosome segregation defects in anaphase cells. Scale bar, 10 µm. b Quantification of anaphase cells with lagging chromosomes in control and morphant embryos expressing zfTTLL11 (+WT) or the catalytically dead zfTTLL11 (+E466G). n (control) = 41 embryos, n (morphant) = 46 embryos, n (+WT) = 39 embryos and n (+E466G) = 31 embryos. The total n is calculated over N = 3 independent experiments. P values based on a two-tailed χ2 test with a 95% confidence interval. Error bars represent SD. c Still images from movies of control and zfTTLL11-MO embryos expressing H2B-mCherry and showing lagging chromosomes forming micronuclei (red arrowheads) in the morphant cells. Time is mm:ss. Scale bar, 20 µm. d Still images from movies of control and zfTTLL11-MO embryos expressing H2B-mCherry and showing micronuclei (orange arrowheads) in the morphant cells. Scale bar, 20 µm. e Quantification from movies of developing zfTTLL11-MO embryos showing at least one event of a lagging chromosome generating a micronucleus at the end of cell division. n (control) = 20 embryos and n (morphant) = 22 embryos coming from N = 3 experiments. Error bars represent the SD. P value based on a two-tailed χ2 test with a 95% confidence interval. Source data are provided as a Source Data file.
|
