Figure 4
- ID
- ZDB-FIG-221211-162
- Publication
- Gao et al., 2022 - Kiaa1024L/Minar2 is essential for hearing by regulating cholesterol distribution in hair bundles
- Other Figures
- All Figure Page
- Back to All Figure Page
|
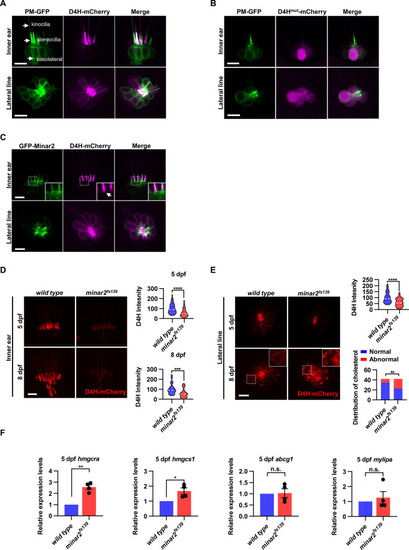
(A) Representative images of PM-GFP and D4H-mCherry expressed in hair cells. The plasma membrane probe PM-GFP labels kinocilia, stereocilia, and basolateral membranes (arrows). The cholesterol probe D4H-mCherry mostly labels the stereocilia in the inner ear. The lateral crista of the inner ear and the L3 lateral line neuromast were imaged. (B) Representative images of PM-GFP and non-binding D4Hmut-mCherry expressed in hair cells. The non-binding D4Hmut-mCherry carried a D4HT490G-L491G mutation that abolishes cholesterol binding. (C) Distribution of GFP-Minar2 and D4H-mCherry in hair cells in stable transgenic zebrafish. GFP-Minar2 and D4H-mCherry extensively co-localize in the stereocilia and a few structures just below the stereocilia (arrow in figure insert). (D) Quantification of the intensity of cholesterol probe D4H-mCherry in the inner ear hair cells. The lateral crista regions of the inner ears were imaged and quantified. For the 5 dpf groups, n=49 and 49 for the wild type and the minar2fs139 mutant, respectively. t=4.446, df = 93.30, ****p<0.0001; For the 8 dpf groups, n=39 and 36, t=3.982, df = 72.30, ***p<0.001. (E) Quantification of the intensity and appearance of D4H-mCherry in the lateral line hair cells. The lateral line L3 neuromasts were imaged and quantified. For the 5 dpf groups, the intensity of D4H-mCherry was quantified. n=40 and 33, t=4.438, df = 70.81, ****p<0.0001. For the 8 dpf groups, the appearance of abnormally enlarged vesicles was quantified. Figure inserts show large vesicles in the basolateral regions in the minar2fs139 mutant. n=42 and 42, **p<0.01, Fisher’s exact test. (F) Quantification of expression levels of genes involved in cholesterol metabolism. The Srebp2 target gene (hmgcra and hmgcs1) and LXR target gene (abcg1 and mylipa) were examined by qRT-PCR. Expression levels relative to GAPDH levels were normalized to the wild-type control group. For hmgcra, t=7.805, df = 3, **p<0.01. For hmgcs1, t=3.217, df = 3, *p<0.05. Scale bars represent 10 μm.
|

