|
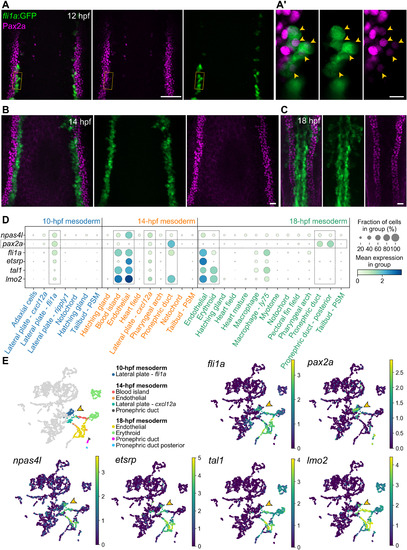
Fig. 4. fli1a and pax2a/Pax2a expression overlap during early stages of wild-type development and largely segregate before 14 hpf. Confocal imaging reveals overlapping expression of fli1a:GFP and Pax2a (A), which decreases by 14 hpf (B), and is not detected at 18 hpf (C). Images of individual 0.74 μm optical sections (A′) clearly suggest colocalization. Yellow arrowheads point to double-positive cells. (D) Mapping of 10 to 18 hpf mesodermal cells from a single-cell time course dataset (39) suggests coexpression of endothelial markers and pax2a at 10 hpf, which decreases over time. PSM, presomitic mesoderm. (E) UMAP plots showing the expression of npas4l, pax2a, fli1a, tal1, lmo2, and etsrp; arrowheads point to the 10 hpf fli1a/pax2a double-positive cluster. Relevant clusters have been color-coded in the left plot in (E) and boxed with dotted lines in (D). “Pronephric duct” = pronephron tubule. Scale bars, 50 μm (A), 10 μm (A′), and 20 μm (B and C).
|