|
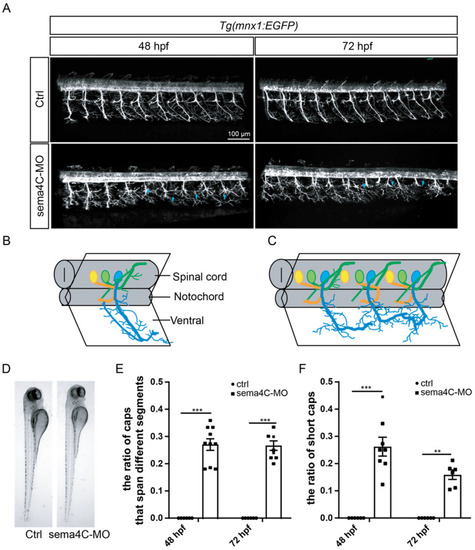
The abnormal development of primary motor neurons in the sema4C deficiency zebrafish. (A). Confocal imaging analysis of primary motor neurons in control and sema4C knockdown Tg(mnx1:EGFP) zebrafish at 48 and 72 hpf, blue arrowheads indicate aberrant Caps; (B). The schematic diagram for three different primary motor neurons in the control fish; (C). The schematic diagram for the abnormal pattern in the sema4C morphants, in which the axonal trajectories of Caps were dramatically misled; (D). Zebrafish embryos of control and sema4C-MO injected at 72 hpf imaged in bright field; (E). The statistical analysis of the ratio of Caps across different segments in the control and sema4C morphants at 48 and 72 hpf. Mann–Whitney test, 48 hpf: *** p = 0.0007; *** 72 hpf: p = 0.0007; (F). The statistical analysis of the ratio of short Caps in the wild types and sema4C morphants at 48 and 72 hpf. Mann–Whitney test, 48 hpf: *** p = 0.0007; 72 hpf: ** p = 0.0022.
|